from sklearn.cluster import KMeans
import matplotlib.pyplot as plt
import seaborn as sns
from tqdm import tqdm
from katlas.core import *
from katlas.plot import *
import pandas as pd, numpy as npKmeans motifs
Kmeans
Data
# human = pd.read_parquet('raw/human_phosphoproteome.parquet')
# df_grouped = pd.read_parquet('raw/combine_source_grouped.parquet')
human = Data.get_human_site()
df_grouped = Data.get_ks_dataset()
all_site = pd.concat([human,df_grouped])all_site.sub_site.isna().sum()0all_site = all_site.drop_duplicates('sub_site')all_site.shape(131843, 19)# all_site = all_site[['sub_site','site_seq']].drop_duplicates('sub_site')One-hot encode
onehot = onehot_encode(all_site['site_seq'])CPU times: user 4.16 s, sys: 768 ms, total: 4.93 s
Wall time: 4.93 sonehot.head()| -20A | -20C | -20D | -20E | -20F | -20G | -20H | -20I | -20K | -20L | ... | 20R | 20S | 20T | 20V | 20W | 20Y | 20_ | 20s | 20t | 20y | |
|---|---|---|---|---|---|---|---|---|---|---|---|---|---|---|---|---|---|---|---|---|---|
| 0 | 0.0 | 0.0 | 0.0 | 0.0 | 0.0 | 0.0 | 0.0 | 0.0 | 0.0 | 0.0 | ... | 1.0 | 0.0 | 0.0 | 0.0 | 0.0 | 0.0 | 0.0 | 0.0 | 0.0 | 0.0 |
| 1 | 0.0 | 0.0 | 0.0 | 0.0 | 0.0 | 0.0 | 0.0 | 0.0 | 0.0 | 0.0 | ... | 0.0 | 0.0 | 0.0 | 0.0 | 0.0 | 0.0 | 0.0 | 0.0 | 0.0 | 0.0 |
| 2 | 0.0 | 0.0 | 0.0 | 1.0 | 0.0 | 0.0 | 0.0 | 0.0 | 0.0 | 0.0 | ... | 0.0 | 0.0 | 0.0 | 0.0 | 0.0 | 0.0 | 0.0 | 0.0 | 0.0 | 0.0 |
| 3 | 0.0 | 0.0 | 0.0 | 1.0 | 0.0 | 0.0 | 0.0 | 0.0 | 0.0 | 0.0 | ... | 0.0 | 0.0 | 0.0 | 0.0 | 0.0 | 0.0 | 0.0 | 0.0 | 0.0 | 0.0 |
| 4 | 0.0 | 0.0 | 0.0 | 0.0 | 0.0 | 0.0 | 0.0 | 0.0 | 0.0 | 0.0 | ... | 0.0 | 0.0 | 0.0 | 0.0 | 0.0 | 0.0 | 0.0 | 0.0 | 0.0 | 0.0 |
5 rows × 967 columns
Elbow method
all_site.shape(131843, 19)sns.set(rc={"figure.dpi":300, 'savefig.dpi':300})
sns.set_context('notebook')
sns.set_style("ticks")get_clusters_elbow(onehot)CPU times: user 23min 20s, sys: 46.3 s, total: 24min 6s
Wall time: 9min 50s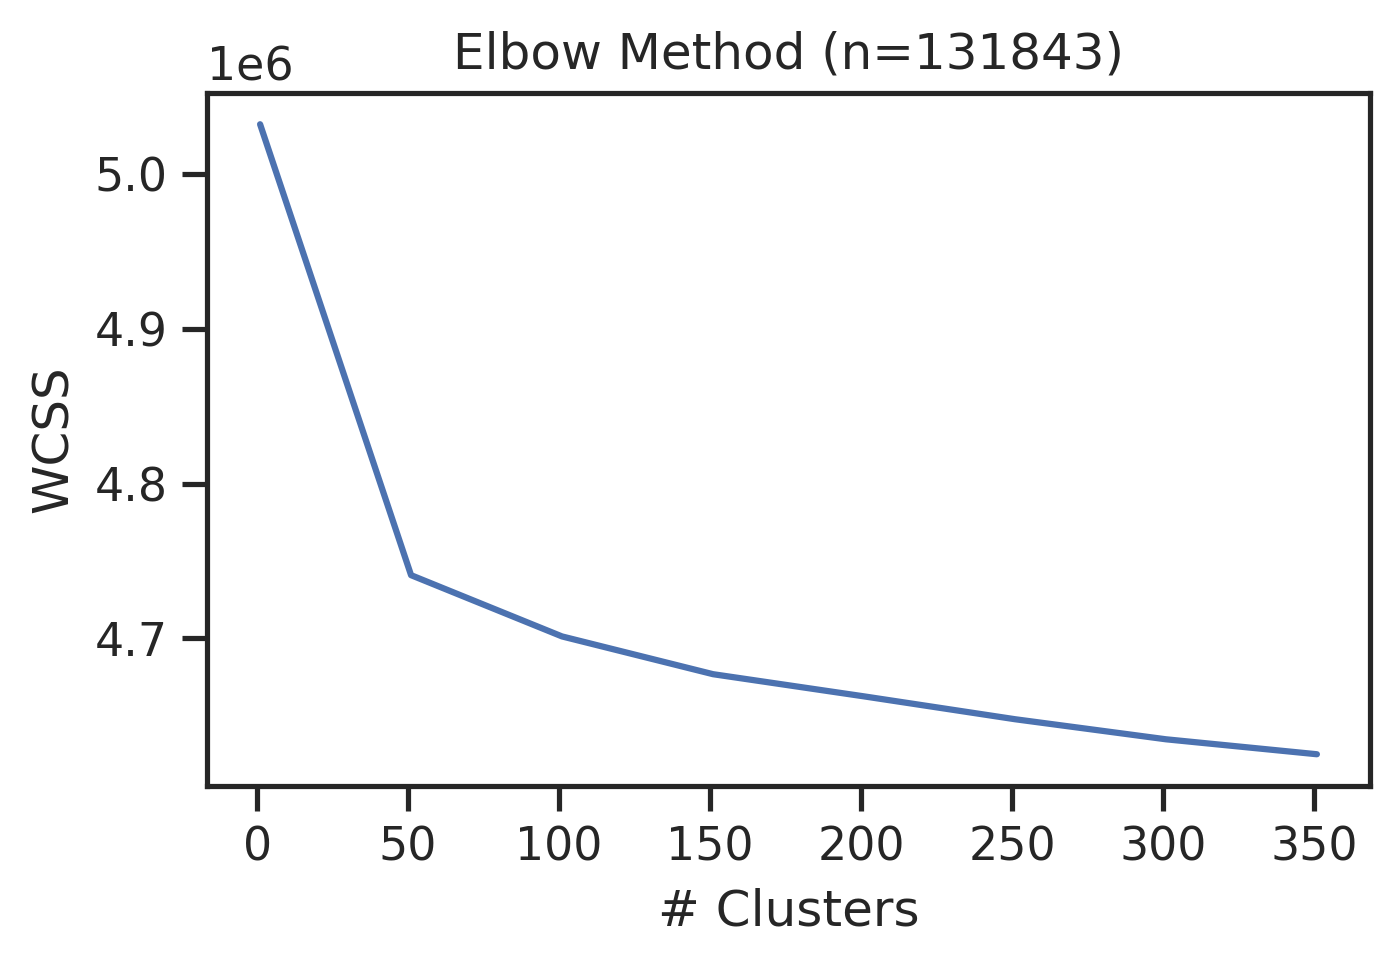
Kmeans
If using RAPIDS
# # pip install --extra-index-url=https://pypi.nvidia.com \"cudf-cu12==25.2.*\" \"cuml-cu12==25.2.*\"

# %load_ext cudf.pandas

# import numpy as np, pandas as pd
# from cuml import KMeans
# import matplotlib.pyplot as plt
# import seaborn as sns
# from tqdm import tqdm
# from katlas.core import *
# from katlas.plot import *
def kmeans(onehot,n=2,seed=42):
kmeans = KMeans(n_clusters=n, random_state=seed,n_init='auto')
return kmeans.fit_predict(onehot)ncluster=[50,150,300]
seeds=[42,2025,28]all_site['test_id']=1get_cluster_pssms(all_site,'test_id')100%|██████████| 1/1 [00:03<00:00, 3.73s/it]| -20P | -20G | -20A | -20C | -20S | -20T | -20V | -20I | -20L | -20M | ... | 20H | 20K | 20R | 20Q | 20N | 20D | 20E | 20pS | 20pT | 20pY | |
|---|---|---|---|---|---|---|---|---|---|---|---|---|---|---|---|---|---|---|---|---|---|
| 1 | 0.07984 | 0.06669 | 0.07291 | 0.01333 | 0.06488 | 0.04065 | 0.0505 | 0.0346 | 0.0812 | 0.01958 | ... | 0.02192 | 0.06782 | 0.06339 | 0.04731 | 0.0334 | 0.05239 | 0.0798 | 0.04184 | 0.01385 | 0.00508 |
1 rows × 943 columns
pssms=[]
for seed in seeds:
    print('seed',seed)
    for n in ncluster:
        colname = f'cluster{n}_seed{seed}'
        print(colname)
        all_site[colname] = kmeans(onehot,n=n,seed=seed)
        pssm_df = get_cluster_pssms(all_site,colname,blank_thr=0.5)
        pssm_df.index =colname+'_'+pssm_df.index.astype(str)
        pssms.append(pssm_df)
seed 42
cluster50_seed42100%|██████████| 50/50 [00:04<00:00, 11.50it/s]cluster150_seed42100%|██████████| 150/150 [00:06<00:00, 23.67it/s]cluster300_seed42100%|██████████| 300/300 [00:09<00:00, 32.17it/s]seed 2025
cluster50_seed2025100%|██████████| 50/50 [00:04<00:00, 12.48it/s]cluster150_seed2025100%|██████████| 150/150 [00:06<00:00, 23.80it/s]cluster300_seed2025100%|██████████| 300/300 [00:09<00:00, 32.20it/s]seed 28
cluster50_seed28100%|██████████| 50/50 [00:04<00:00, 12.24it/s]cluster150_seed28100%|██████████| 150/150 [00:06<00:00, 23.97it/s]cluster300_seed28100%|██████████| 300/300 [00:09<00:00, 30.65it/s]pssms = pd.concat(pssms,axis=0)Save:
# pssms.to_parquet('raw/kmeans.parquet')
# all_site.to_parquet('raw/kmeans_site.parquet',index=False)
pssms = pd.read_parquet('raw/kmeans.parquet')
all_site=pd.read_parquet('raw/kmeans_site.parquet')all_site.head()| substrate_uniprot | substrate_genes | site | source | AM_pathogenicity | substrate_sequence | substrate_species | sub_site | substrate_phosphoseq | position | ... | test_id | cluster50_seed42 | cluster150_seed42 | cluster300_seed42 | cluster50_seed2025 | cluster150_seed2025 | cluster300_seed2025 | cluster50_seed28 | cluster150_seed28 | cluster300_seed28 | |
|---|---|---|---|---|---|---|---|---|---|---|---|---|---|---|---|---|---|---|---|---|---|
| 0 | A0A024R4G9 | C19orf48 MGC13170 hCG_2008493 | S20 | psp | NaN | MTVLEAVLEIQAITGSRLLSMVPGPARPPGSCWDPTQCTRTWLLSH... | Homo sapiens (Human) | A0A024R4G9_S20 | MTVLEAVLEIQAITGSRLLsMVPGPARPPGSCWDPTQCTRTWLLSH... | 20 | ... | 1 | 33 | 126 | 187 | 48 | 136 | 119 | 3 | 45 | 261 |
| 1 | A0A075B6Q4 | None | S24 | ochoa | NaN | MDIQKSENEDDSEWEDVDDEKGDSNDDYDSAGLLSDEDCMSVPGKT... | Homo sapiens (Human) | A0A075B6Q4_S24 | MDIQKSENEDDSEWEDVDDEKGDsNDDYDSAGLLsDEDCMSVPGKT... | 24 | ... | 1 | 41 | 28 | 288 | 42 | 117 | 28 | 2 | 149 | 149 |
| 2 | A0A075B6Q4 | None | S35 | ochoa | NaN | MDIQKSENEDDSEWEDVDDEKGDSNDDYDSAGLLSDEDCMSVPGKT... | Homo sapiens (Human) | A0A075B6Q4_S35 | MDIQKSENEDDSEWEDVDDEKGDsNDDYDSAGLLsDEDCMSVPGKT... | 35 | ... | 1 | 45 | 102 | 100 | 30 | 122 | 122 | 6 | 149 | 149 |
| 3 | A0A075B6Q4 | None | S57 | ochoa | NaN | MDIQKSENEDDSEWEDVDDEKGDSNDDYDSAGLLSDEDCMSVPGKT... | Homo sapiens (Human) | A0A075B6Q4_S57 | MDIQKSENEDDSEWEDVDDEKGDsNDDYDSAGLLsDEDCMSVPGKT... | 57 | ... | 1 | 30 | 81 | 81 | 30 | 122 | 58 | 40 | 110 | 252 |
| 4 | A0A075B6Q4 | None | S68 | ochoa | NaN | MDIQKSENEDDSEWEDVDDEKGDSNDDYDSAGLLSDEDCMSVPGKT... | Homo sapiens (Human) | A0A075B6Q4_S68 | MDIQKSENEDDSEWEDVDDEKGDsNDDYDSAGLLsDEDCMSVPGKT... | 68 | ... | 1 | 11 | 75 | 68 | 10 | 48 | 164 | 39 | 97 | 137 |
5 rows × 29 columns
Get JS distance
Get 1D distance
def compute_distance_matrix(df,func):
    "Compute 1D distance matrix for each row in a dataframe given a distance function "
    n = len(df)
    dist = []
    for i in tqdm(range(n)):
        for j in range(i+1, n):
            d = func(df.iloc[i], df.iloc[j])
            dist.append(d)
    return np.array(dist)
from tqdm.contrib.concurrent import process_map
from functools import partial
import numpy as np
import pandas as pd
def compute_distance(pair, df, func):
i, j = pair
return func(df.iloc[i], df.iloc[j])
def compute_distance_matrix_parallel(df, func, max_workers=4, chunksize=100):
n = len(data)
index_pairs = [(i, j) for i in range(n) for j in range(i + 1, n)]
# Create a wrapper for partial application
bound_worker = partial(compute_distance, data=df, func=func)
dist = process_map(bound_worker, index_pairs, max_workers=max_workers, chunksize=chunksize)
return np.array(dist)from fastcore.meta import delegates
from functools import partial
from tqdm.contrib.concurrent import process_mapdef compute_distance_matrix_parallel(df, func, max_workers=4, chunksize=100):
n = len(df)
index_pairs = [(i, j) for i in range(n) for j in range(i + 1, n)]
bound_worker = partial(compute_distance, df=df, func=func)
dist = process_map(bound_worker, index_pairs, max_workers=max_workers, chunksize=chunksize)
return np.array(dist)@delegates(compute_distance_matrix_parallel)
def compute_JS_matrix_parallel(df, func=js_divergence_flat, **kwargs):
"Compute 1D distance matrix using JS divergence."
return compute_distance_matrix_parallel(df, func=func, **kwargs)pssms[pssms.index.str.contains('cluster0')]| -20P | -20G | -20A | -20C | -20S | -20T | -20V | -20I | -20L | -20M | ... | 20H | 20K | 20R | 20Q | 20N | 20D | 20E | 20pS | 20pT | 20pY |
|---|
0 rows × 943 columns
distances = compute_JS_matrix_parallel(pssms,max_workers=32)distancesarray([0.02719099, 0.02964083, 0.03350885, ..., 0.23451136, 0.32064881,
0.29473009])Hierarchical clustering
from scipy.cluster.hierarchy import linkage, fcluster,dendrogramZ = linkage(distances, method='ward')def plot_dendrogram(Z,output='dendrogram.pdf',color_thr=0.03,**kwargs):
length=(len(Z)+1)//8
plt.figure(figsize=(5,length))
dendrogram(Z, orientation='left', leaf_font_size=7, color_threshold=color_thr,**kwargs)
plt.title('Hierarchical Clustering Dendrogram')
plt.ylabel('Distance')
plt.savefig(output, bbox_inches='tight')
plt.close()labels = [i+': '+pssm_to_seq(recover_pssm(r),0.2) for i,r in pssms.iterrows()]labels[:5]['cluster50_seed42_28: ....................t*....................',
'cluster50_seed42_2: ....................y*....................',
'cluster50_seed42_31: ....................y*....................',
'cluster50_seed42_10: ..................sPt*.s..................',
'cluster50_seed42_9: ....................s*....................']# plot_dendrogram(Z,output='raw/dendrogram1.pdf',labels=labels)Visualize and find out the color threshold that works.
After determine the color threshold, use it to cut the tree.
Visualize some logos
plot_logos(pssms, 'cluster300_seed28_217','cluster50_seed42_40')
Cut trees
labels = fcluster(Z, t=0.03, criterion='distance')
# pssm_df['cluster'] = labelsZ.shape(1460, 4)len(labels)1461np.unique(labels)[:10] # always start from 1array([ 1, 2, 3, 4, 5, 6, 7, 8, 9, 10], dtype=int32)Expand the cluster into a single column
id_vars = ['sub_site', 'site_seq']
value_vars = [col for col in all_site.columns if col.startswith('cluster')]
all_site_long = pd.melt(all_site, id_vars=id_vars, value_vars=value_vars, var_name='cluster_info', value_name='cluster')all_site_long['cluster_id']=all_site_long['cluster_info'] + '_' + all_site_long['cluster'].astype(str)all_site_long.head()| sub_site | site_seq | cluster_info | cluster | cluster_id | |
|---|---|---|---|---|---|
| 0 | A0A024R4G9_S20 | _MTVLEAVLEIQAITGSRLLsMVPGPARPPGSCWDPTQCTR | cluster50_seed42 | 33 | cluster50_seed42_33 |
| 1 | A0A075B6Q4_S24 | QKSENEDDSEWEDVDDEKGDsNDDYDSAGLLsDEDCMSVPG | cluster50_seed42 | 41 | cluster50_seed42_41 |
| 2 | A0A075B6Q4_S35 | EDVDDEKGDsNDDYDSAGLLsDEDCMSVPGKTHRAIADHLF | cluster50_seed42 | 45 | cluster50_seed42_45 |
| 3 | A0A075B6Q4_S57 | EDCMSVPGKTHRAIADHLFWsEETKSRFTEYsMTssVMRRN | cluster50_seed42 | 30 | cluster50_seed42_30 |
| 4 | A0A075B6Q4_S68 | RAIADHLFWsEETKSRFTEYsMTssVMRRNEQLTLHDERFE | cluster50_seed42 | 11 | cluster50_seed42_11 |
# all_site_long.to_parquet('raw/kmeans_site_long.parquet',index=False)Map new cluster
len(labels)1461cluster_map = pd.Series(labels,index=pssms.index)cluster_map.sort_values()cluster150_seed2025_55 1
cluster300_seed28_117 1
cluster150_seed28_117 1
cluster300_seed2025_293 1
cluster300_seed28_28 2
...
cluster150_seed2025_67 747
cluster300_seed2025_9 747
cluster300_seed28_115 747
cluster300_seed2025_278 748
cluster300_seed42_44 748
Length: 1461, dtype: int32For those unmapped cluster_ID, we assign them zero value:
# not all cluster_id have a corresponding for new cluster ID, as they could be filtered out
all_site_long['cluster_new'] = all_site_long.cluster_id.map(lambda x: cluster_map.get(x, 0)) #0 is unmapped
# all_site_long.to_parquet('raw/kmeans_site_long_cluster_new.parquet',index=False)Get new cluster motifs
get_cluster_pssms?Signature: get_cluster_pssms( df, cluster_col, seq_col='site_seq', id_col='sub_site', count_thr=10, valid_thr=None, plot=False, ) Docstring: Extract motifs from clusters in a dataframe File: /tmp/ipykernel_2927/3575038003.py Type: function
get_cluster_pssms?Signature: get_cluster_pssms( df, cluster_col, seq_col='site_seq', id_col='sub_site', count_thr=10, valid_thr=None, plot=False, ) Docstring: Extract motifs from clusters in a dataframe File: /tmp/ipykernel_2927/1868936855.py Type: function
pssms2 = get_cluster_pssms(all_site_long,
                           'cluster_new',
                           count_thr=10,
                           blank_thr=0.3)
100%|██████████| 749/749 [00:22<00:00, 33.07it/s]pssms2.shape(749, 943)pssms2 = pssms2.drop(index=0) # as 0 represents unmappedpssms2.sort_index().to_parquet('out/all_site_pssms.parquet')distances = compute_JS_matrix_parallel(pssms2)
Z = linkage(distances, method='ward')all_site_long.cluster_new0 447
1 349
2 277
3 396
4 365
...
1186582 664
1186583 541
1186584 660
1186585 679
1186586 676
Name: cluster_new, Length: 1186587, dtype: int64count_map = all_site_long.drop_duplicates(subset=["cluster_new","sub_site"])["cluster_new"].value_counts()count_mapcluster_new
548 10755
676 10570
689 9921
577 8877
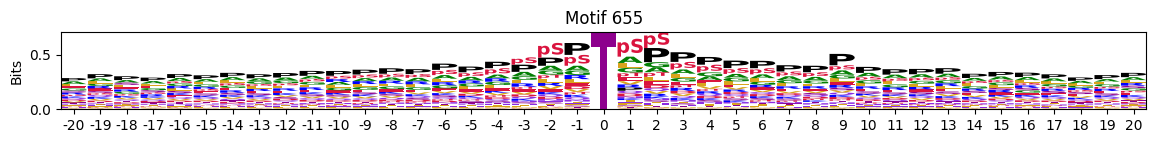
655 8153
...
4 96
260 91
18 82
724 73
261 67
Name: count, Length: 749, dtype: int64def pssm_to_seq(pssm_df,
thr=0.4, # threshold of probability to show in sequence
clean_center=True, # if true, zero out non-last three values in position 0 (keep only s,t,y values at center)
):
"Represent PSSM in string sequence of amino acids"
pssm_df = pssm_df.copy()
if clean_center:
pssm_df.loc[pssm_df.index[:-3], 0] = 0 # keep only s,t,y in center 0 position
pssm_df.index = pssm_df.index.map(lambda x: x.replace('pS', 's').replace('pT', 't').replace('pY', 'y'))
consensus = []
for i, col in enumerate(pssm_df.columns):
# consider the case where sum for the position is 0
column_vals = pssm_df[col]
if column_vals.sum() == 0:
symbol = '_'
else:
top = column_vals.nlargest(3)
passing = [aa for aa, prob in zip(top.index, top.values) if prob > thr]
if not passing:
symbol = '.'
elif len(passing) == 1:
symbol = passing[0]
else:
symbol = f"[{'/'.join(passing)}]"
if col == 0: # center position
if symbol.startswith('['):
symbol = symbol[:-1] + ']*'
else:
symbol += '*'
consensus.append(symbol)
return ''.join(consensus)labels=[str(i)+f' (n={count_map[i]:,})' + ': '+pssm_to_seq(recover_pssm(r),0.2) for i,r in pssms2.iterrows()]labels[:4]['548 (n=10,755): ....................s*....................',
'676 (n=10,570): ....................y*....................',
'689 (n=9,921): ....................t*....................',
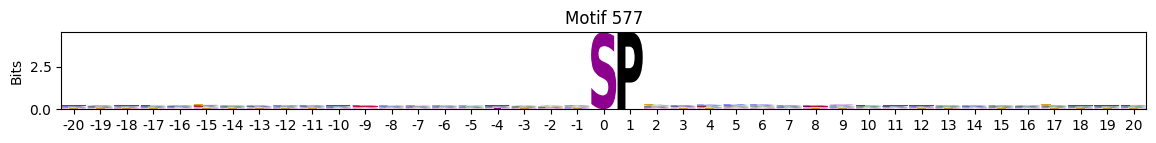
'577 (n=8,877): ....................s*P...................']def plot_dendrogram(Z,output='dendrogram.pdf',color_thr=0.03,**kwargs):
length=(len(Z)+1)//7
plt.figure(figsize=(5,length))
dendrogram(Z, orientation='left', leaf_font_size=7, color_threshold=color_thr,**kwargs)
plt.title('Hierarchical Clustering Dendrogram')
plt.ylabel('Distance')
plt.savefig(output, bbox_inches='tight')
plt.close()plot_dendrogram(Z,output='out/dendrogram_label2.pdf',labels=labels,color_thr=0.07)Onehot of cluster number
all_site_long['sub_site_seq'] = all_site_long['sub_site']+'_'+all_site_long['site_seq']all_site_onehot = pd.crosstab(all_site_long['sub_site_seq'], all_site_long['cluster_new'])# greater than 0 to be True and convert to int
all_site_onehot = all_site_onehot.gt(0).astype(int)all_site_onehot.max()cluster_new
1 1
2 1
3 1
4 1
5 1
..
744 1
745 1
746 1
747 1
748 1
Length: 748, dtype: int64# remove 0 as it is unassigned for cut tree
all_site_onehot = all_site_onehot.drop(columns=0)all_site_onehot.columnsIndex([ 1, 2, 3, 4, 5, 6, 7, 8, 9, 10,
...
739, 740, 741, 742, 743, 744, 745, 746, 747, 748],
dtype='int64', name='cluster_new', length=748)all_site_onehot.sum().sort_values()cluster_new
261 67
724 73
18 82
260 91
4 96
...
655 8153
577 8877
689 9921
676 10570
548 10755
Length: 748, dtype: int64# all_site_onehot.to_parquet('out/all_site_cluster_onehot.parquet')Special motifs
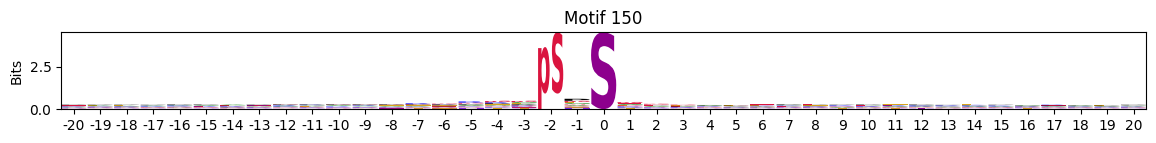
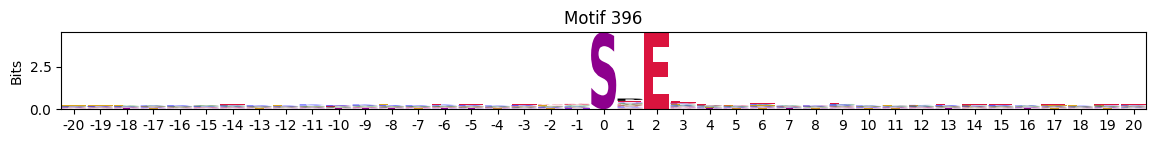
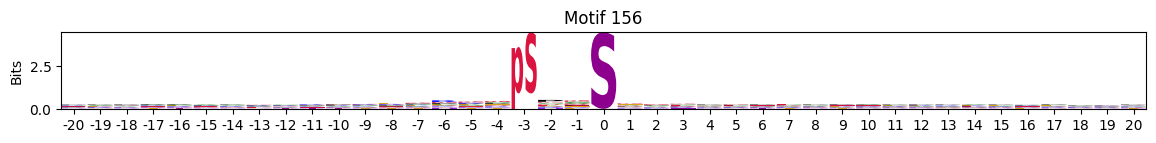
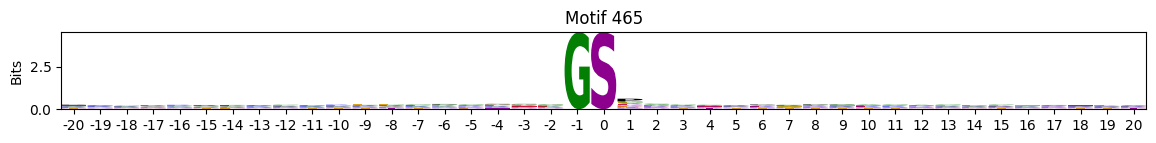
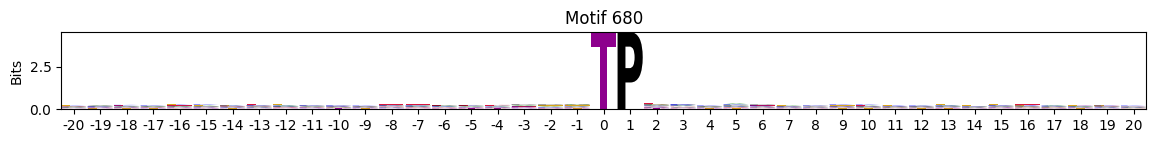
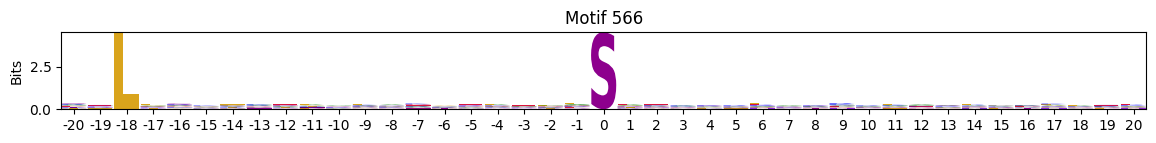
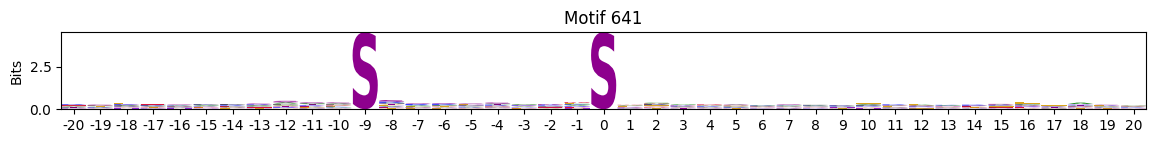
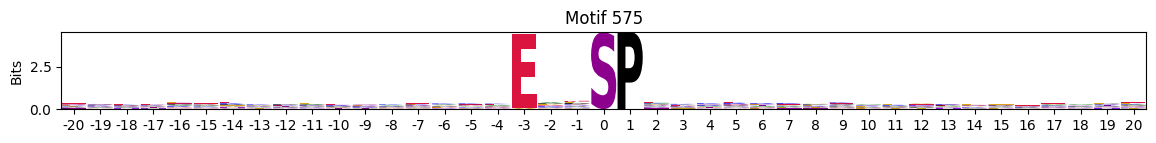
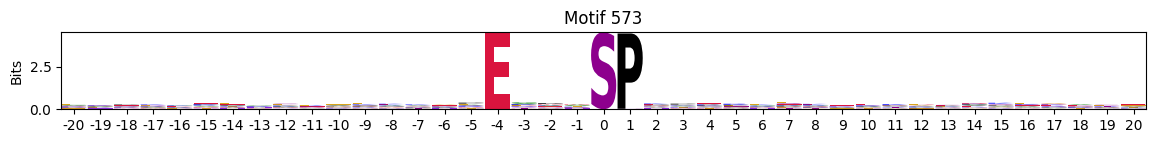
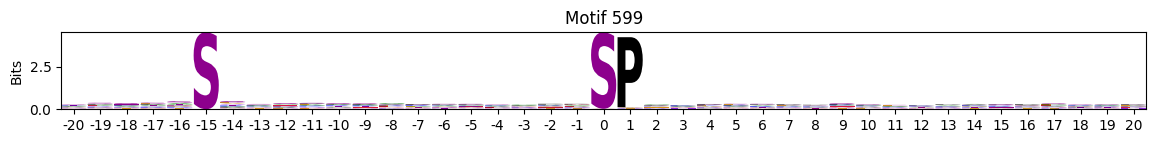
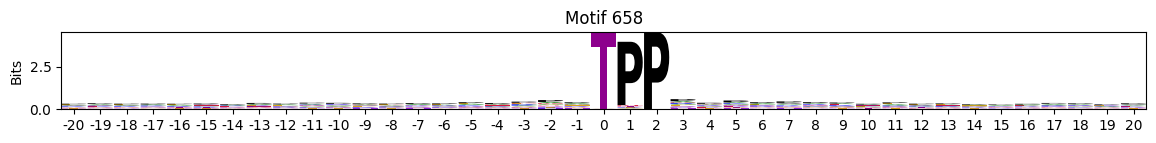
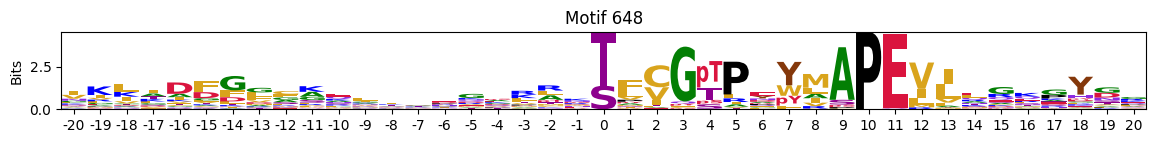
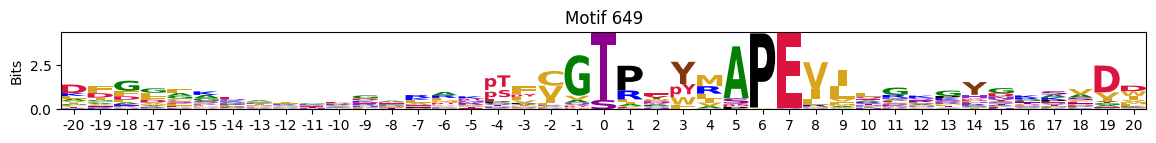
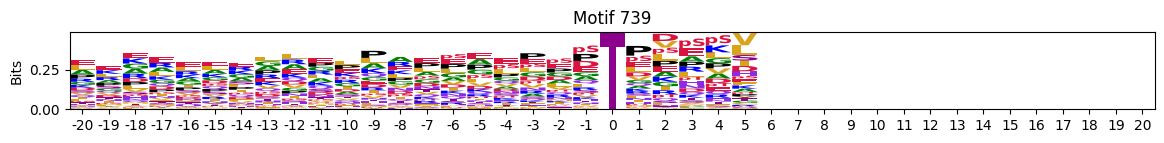
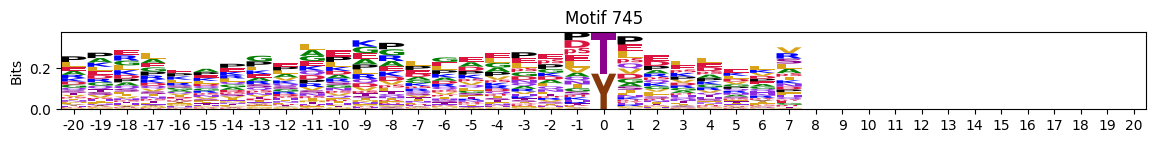
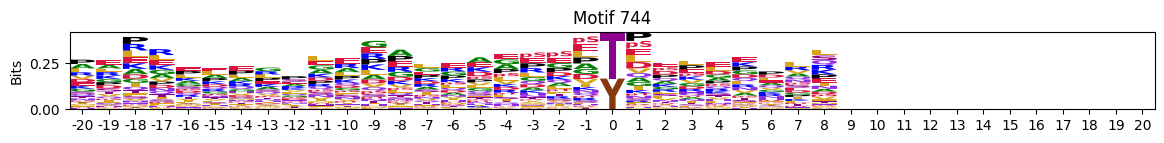
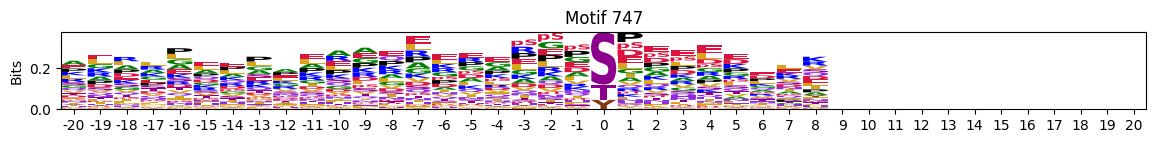
def plot_logos(pssms_df,*idxs):
    "Plot logos of a dataframe with flattened PSSMs with index ad IDs."
    for idx in idxs:
        pssm = recover_pssm(pssms_df.loc[idx])
        plot_logo(pssm,title=f'Motif {idx}',figsize=(14,1))
        plt.show()
        plt.close()
Customized
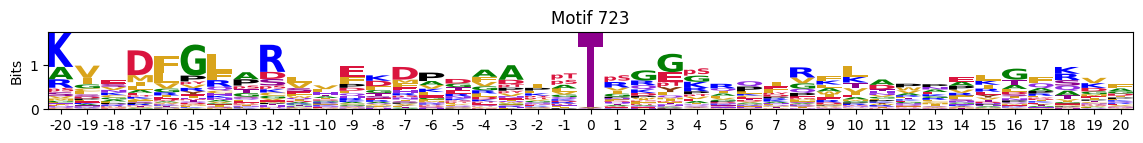
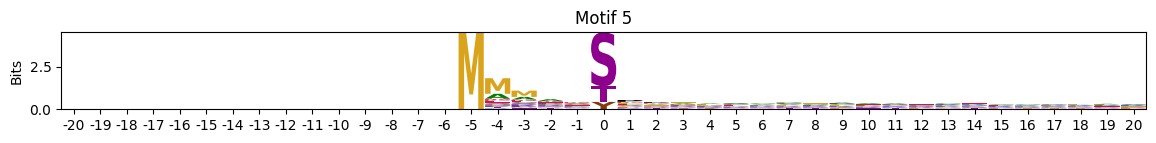
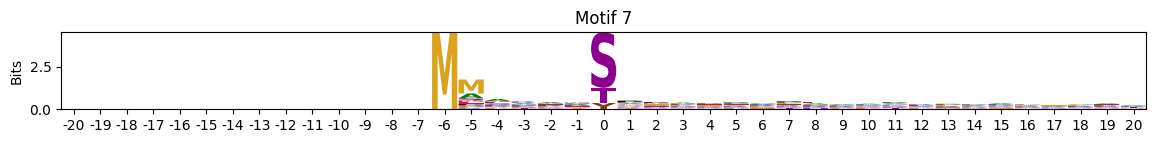
plot_logos(pssms2,121)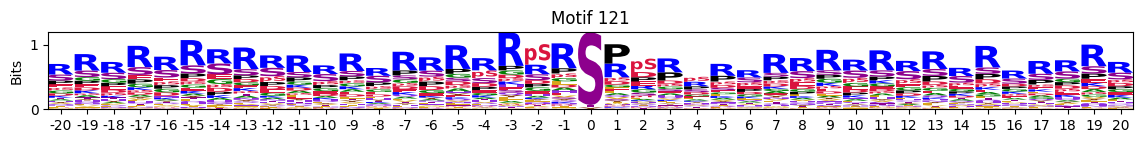
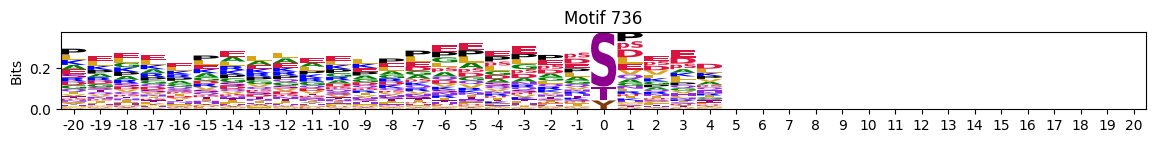
plot_logos(pssms2,224)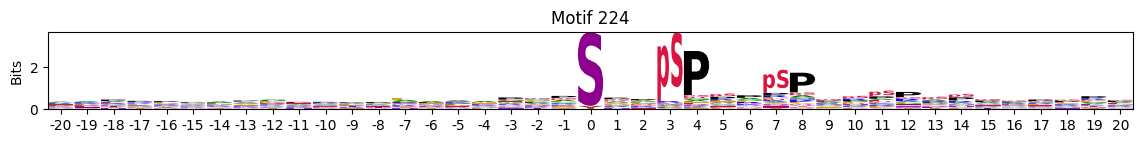
Most common
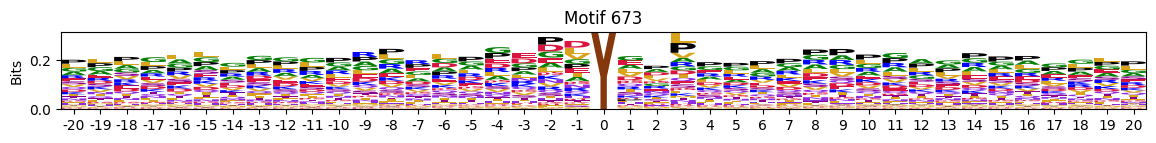
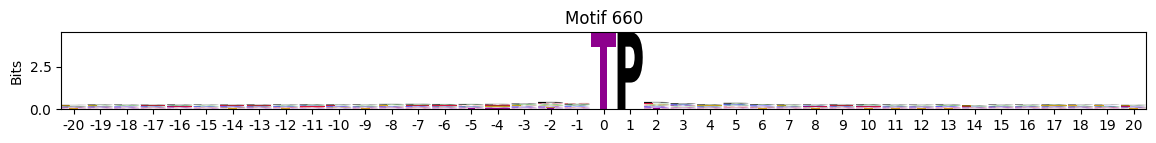
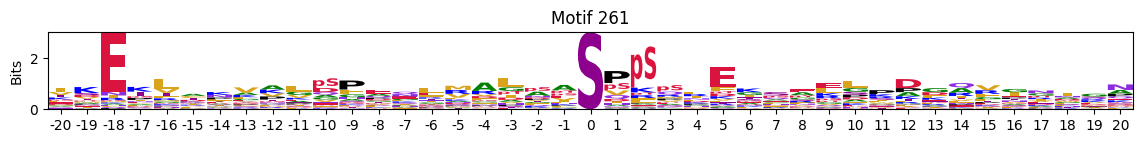
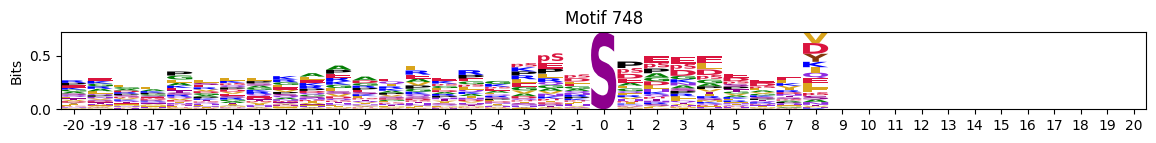
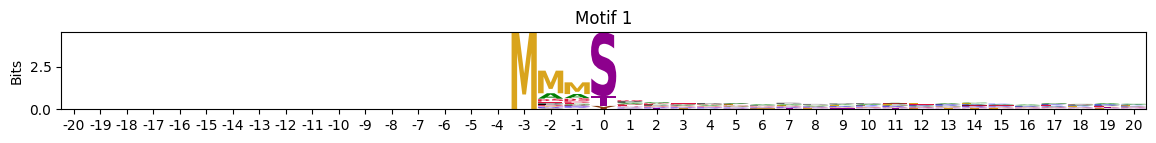
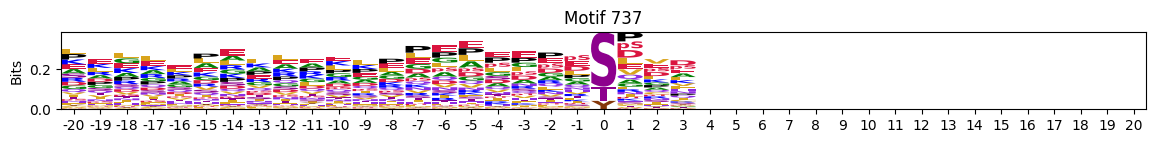
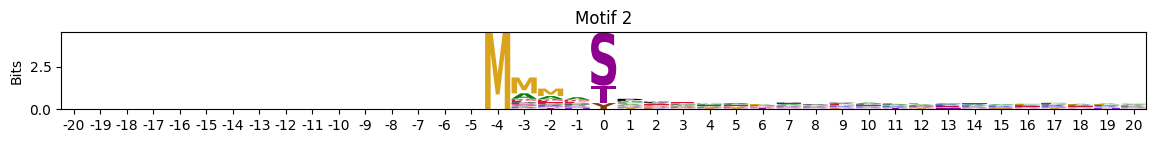
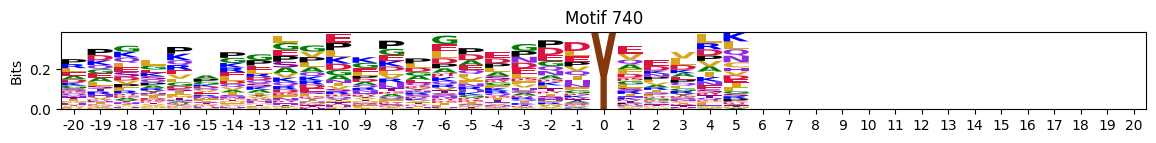
idxs = all_site_onehot.sum().sort_values(ascending=False).head(20).indexplot_logos(pssms2, *idxs)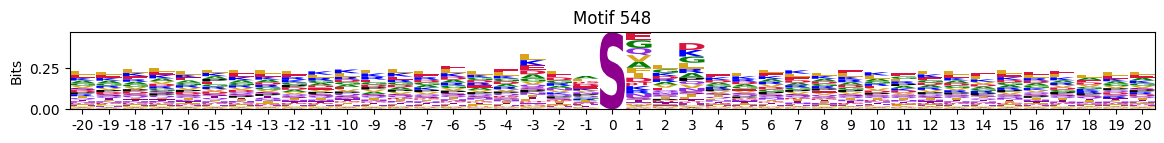
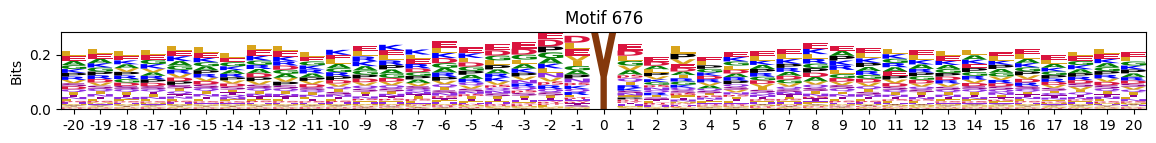
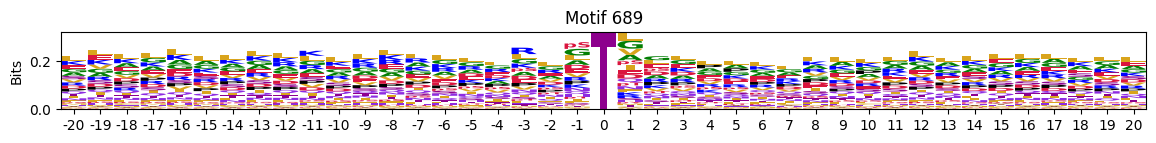
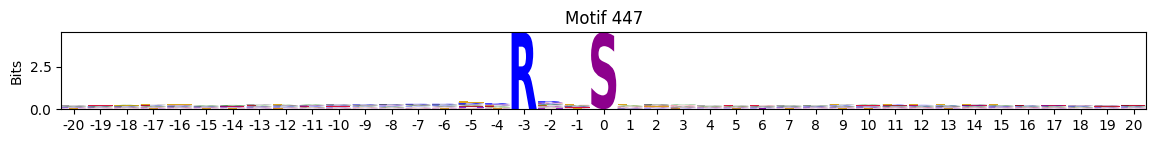
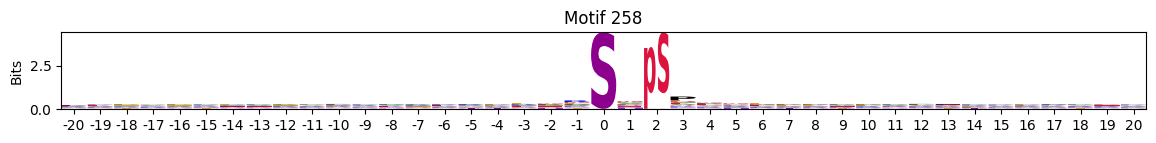
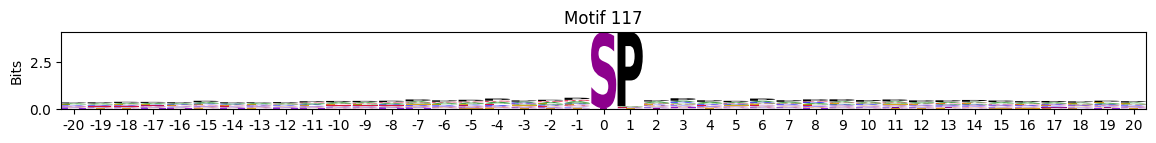
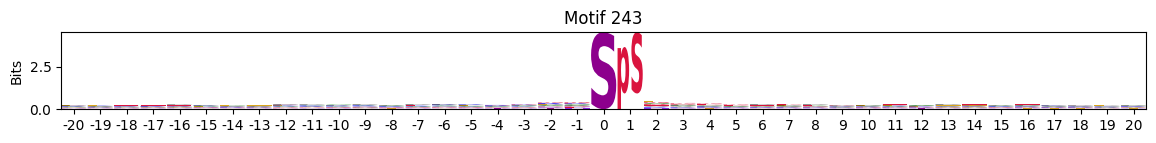
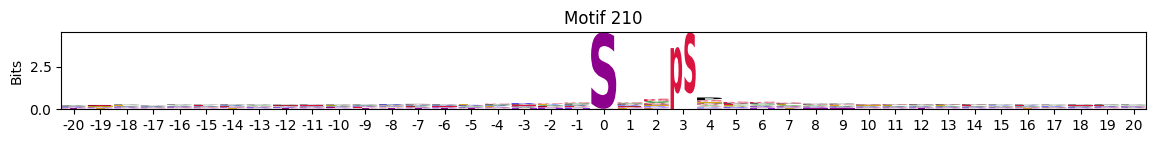
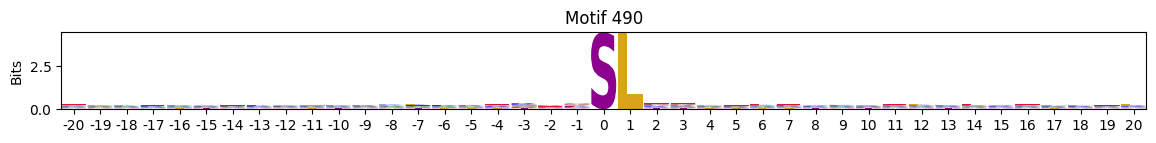
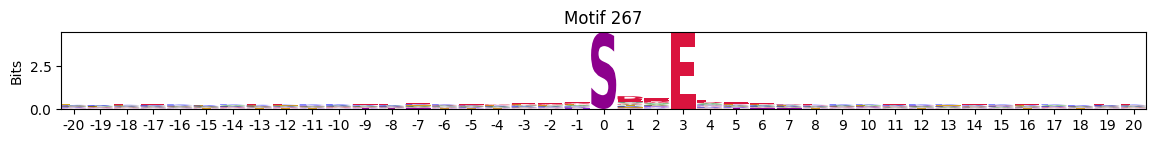
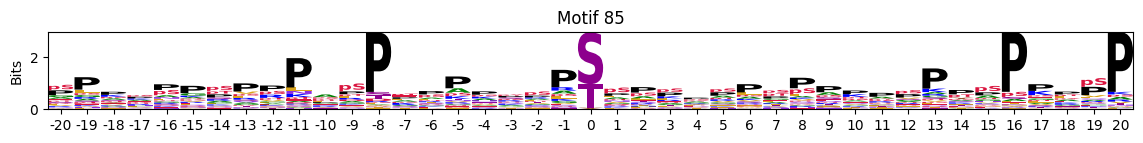
Entropy per position
pssms2_entropy = pssms2.apply(lambda r: entropy_flat(r),axis=1)# remove 0 and focus on those neighboring residues
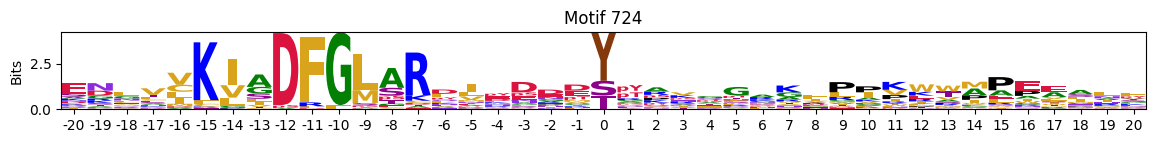
pssms2_entropy = pssms2_entropy.drop(columns=0)idxs=pssms2_entropy.min(1).sort_values().head(10).indexMotif with lowest entropies:
plot_logos(pssms2,*idxs)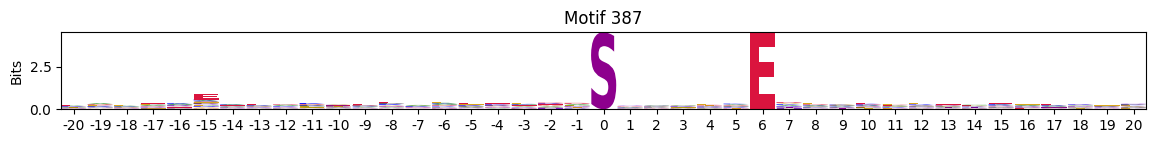

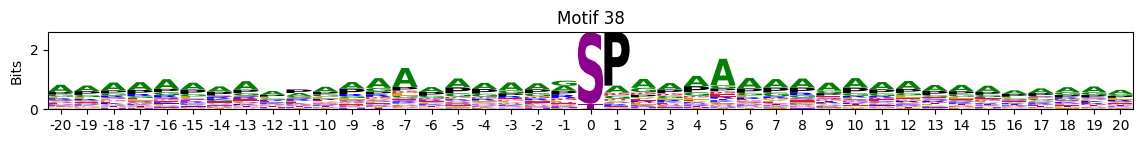
Low median entropy
Motifs with low median entropies:
idxs=pssms2_entropy.median(1).sort_values().head(10).indexThe first one is mostly Zinc finger protein
plot_logos(pssms2,*idxs)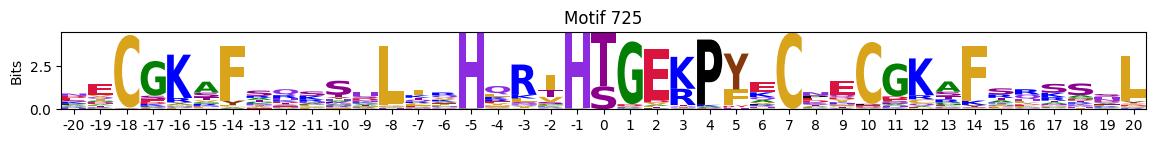

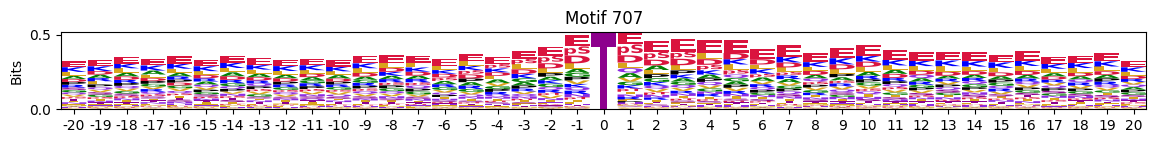
idxs=pssms2_entropy.sum(1).sort_values().head(10).indexidxs=(pssms2==0).sum(1).sort_values(ascending=False).indexC-terminal motifs
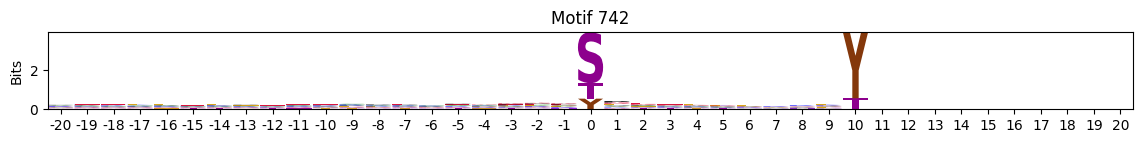
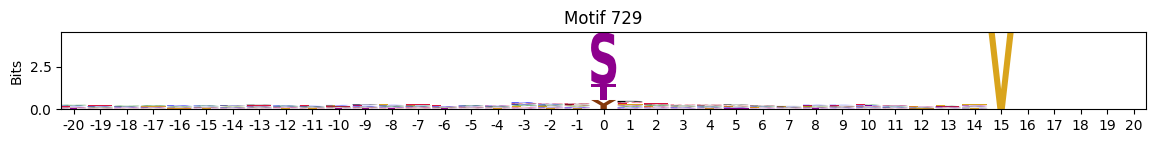
plot_logos(pssms2,732,742,729)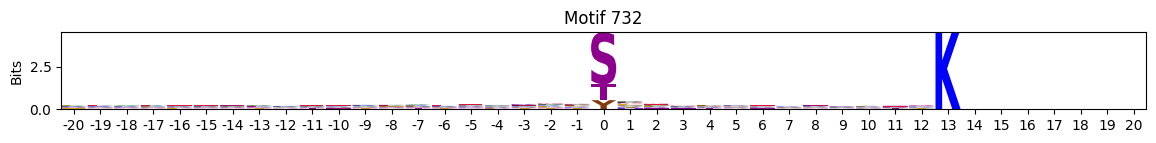
zeros_right = pssms2.apply(lambda r: (recover_pssm(r).loc[:,1:].sum()==0).sum() , axis=1)idxs = zeros_right.sort_values(ascending=False).head(10).indexplot_logos(pssms2,*idxs)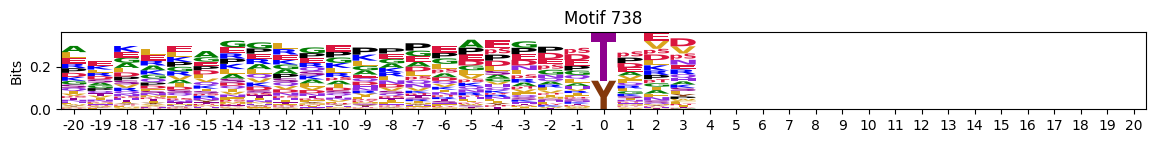


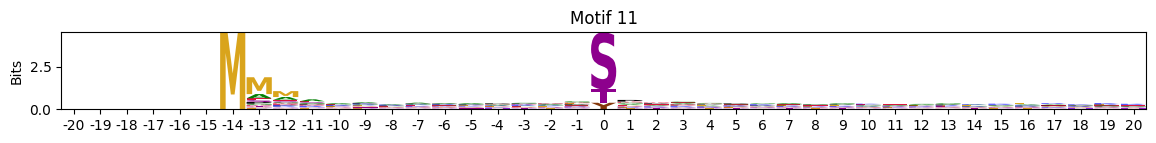
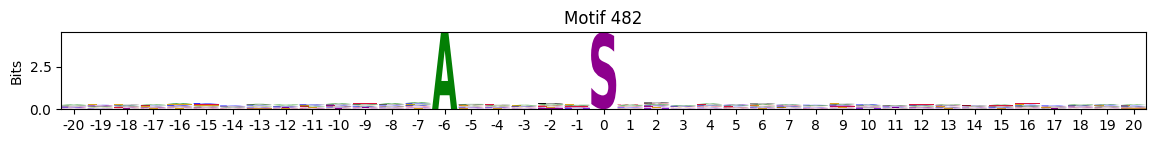
N-Terminal motifs:
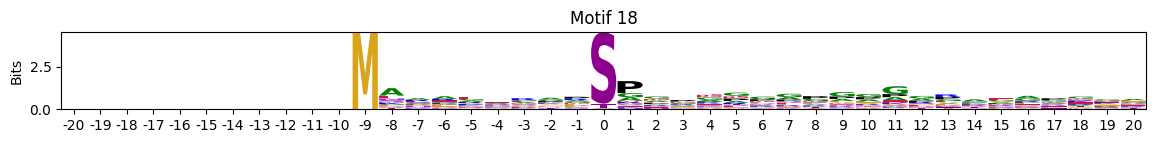
zeros = pssms2.apply(lambda r: (recover_pssm(r).sum()==0).sum() , axis=1)idxs = zeros.sort_values(ascending=False).head(10).indexplot_logos(pssms2,*idxs)


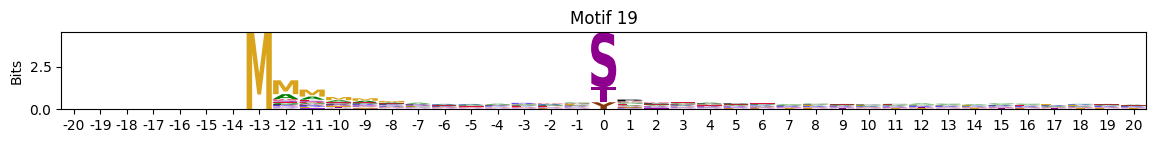
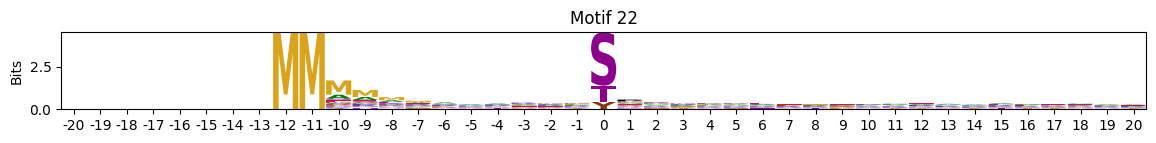
plot_logos(pssms2,8,19,22)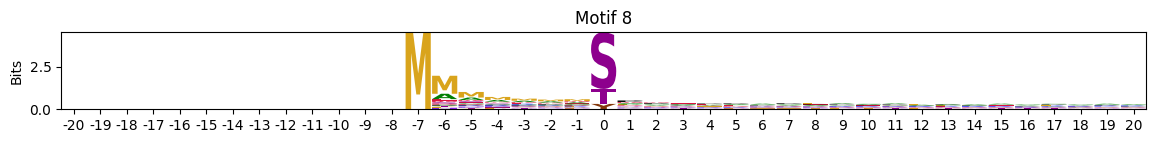
Umap
import pandas as pd
import umap
import matplotlib.pyplot as plt
import seaborn as sns
annot = pd.DataFrame(all_site_pivot.index)annot = annot.merge(all_site[['sub_site','site','site_seq','substrate_genes']])sty = pd.get_dummies(annot['site'].str[0]).astype(int)sty = sty.set_index(all_site_pivot.index)all_site_pivot_sty = pd.concat([all_site_pivot,sty],axis=1)all_site_pivot_sty.head()| 1 | 2 | 3 | 4 | 5 | 6 | 7 | 8 | 9 | 10 | ... | 740 | 741 | 742 | 743 | 744 | 745 | 746 | S | T | Y | |
|---|---|---|---|---|---|---|---|---|---|---|---|---|---|---|---|---|---|---|---|---|---|
| sub_site | |||||||||||||||||||||
| A0A024R4G9_S20 | 0 | 0 | 0 | 0 | 0 | 0 | 0 | 0 | 0 | 0 | ... | 0 | 0 | 0 | 0 | 0 | 0 | 0 | 1 | 0 | 0 |
| A0A075B6Q4_S24 | 0 | 0 | 0 | 0 | 0 | 0 | 0 | 0 | 0 | 0 | ... | 0 | 0 | 0 | 0 | 0 | 0 | 0 | 1 | 0 | 0 |
| A0A075B6Q4_S35 | 0 | 0 | 0 | 0 | 0 | 0 | 0 | 0 | 0 | 0 | ... | 0 | 0 | 0 | 0 | 0 | 0 | 0 | 1 | 0 | 0 |
| A0A075B6Q4_S57 | 0 | 0 | 0 | 0 | 0 | 0 | 0 | 0 | 0 | 0 | ... | 0 | 0 | 0 | 0 | 0 | 0 | 0 | 1 | 0 | 0 |
| A0A075B6Q4_S68 | 0 | 0 | 0 | 0 | 0 | 0 | 0 | 0 | 0 | 0 | ... | 0 | 0 | 0 | 0 | 0 | 0 | 0 | 1 | 0 | 0 |
5 rows × 749 columns
reducer = umap.UMAP(
    n_neighbors=15,
    n_components=2,
    metric='jaccard',
    # min_dist=0.1,
    # random_state=42,
    # verbose=True,
)
embedding = reducer.fit_transform(all_site_pivot_sty)
f:\git\katlas\.venv\lib\site-packages\sklearn\utils\deprecation.py:151: FutureWarning: 'force_all_finite' was renamed to 'ensure_all_finite' in 1.6 and will be removed in 1.8.
warnings.warn(
f:\git\katlas\.venv\lib\site-packages\logomaker/..\umap\umap_.py:1887: UserWarning: gradient function is not yet implemented for jaccard distance metric; inverse_transform will be unavailable
warn(embedding_df = pd.DataFrame(embedding, columns=['UMAP1', 'UMAP2'])sns.scatterplot(data=embedding_df, x='UMAP1', y='UMAP2', alpha=0.5,
s=0.1,
edgecolor='none',hue=annot['site'].str[0])<Axes: xlabel='UMAP1', ylabel='UMAP2'>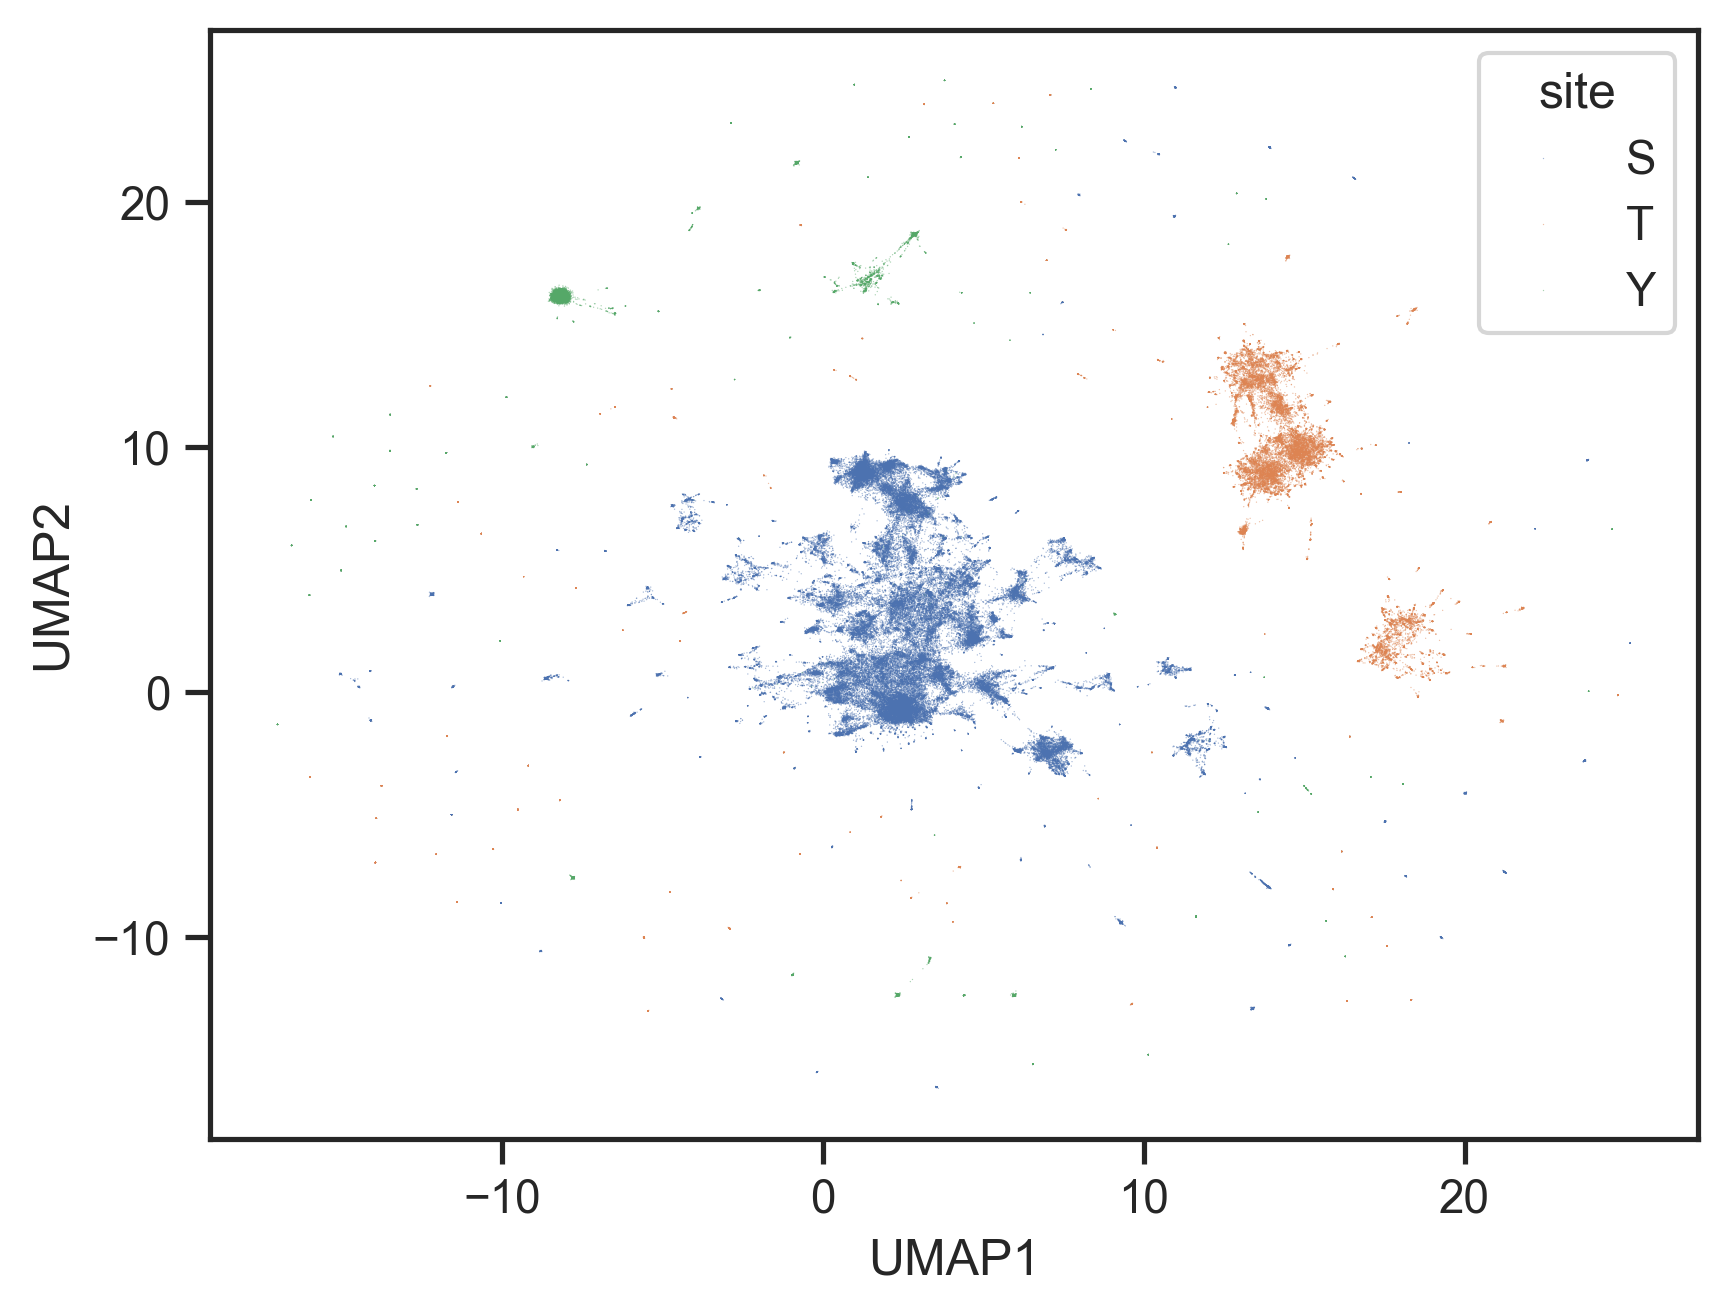
annot['site_seq'].str.len()//20 20
1 20
2 20
3 20
4 20
..
131838 20
131839 20
131840 20
131841 20
131842 20
Name: site_seq, Length: 131843, dtype: int64sns.scatterplot(data=embedding_df, x='UMAP1', y='UMAP2', alpha=0.5,
s=0.1,
edgecolor='none',hue=annot['site_seq'].str[21])<Axes: xlabel='UMAP1', ylabel='UMAP2'>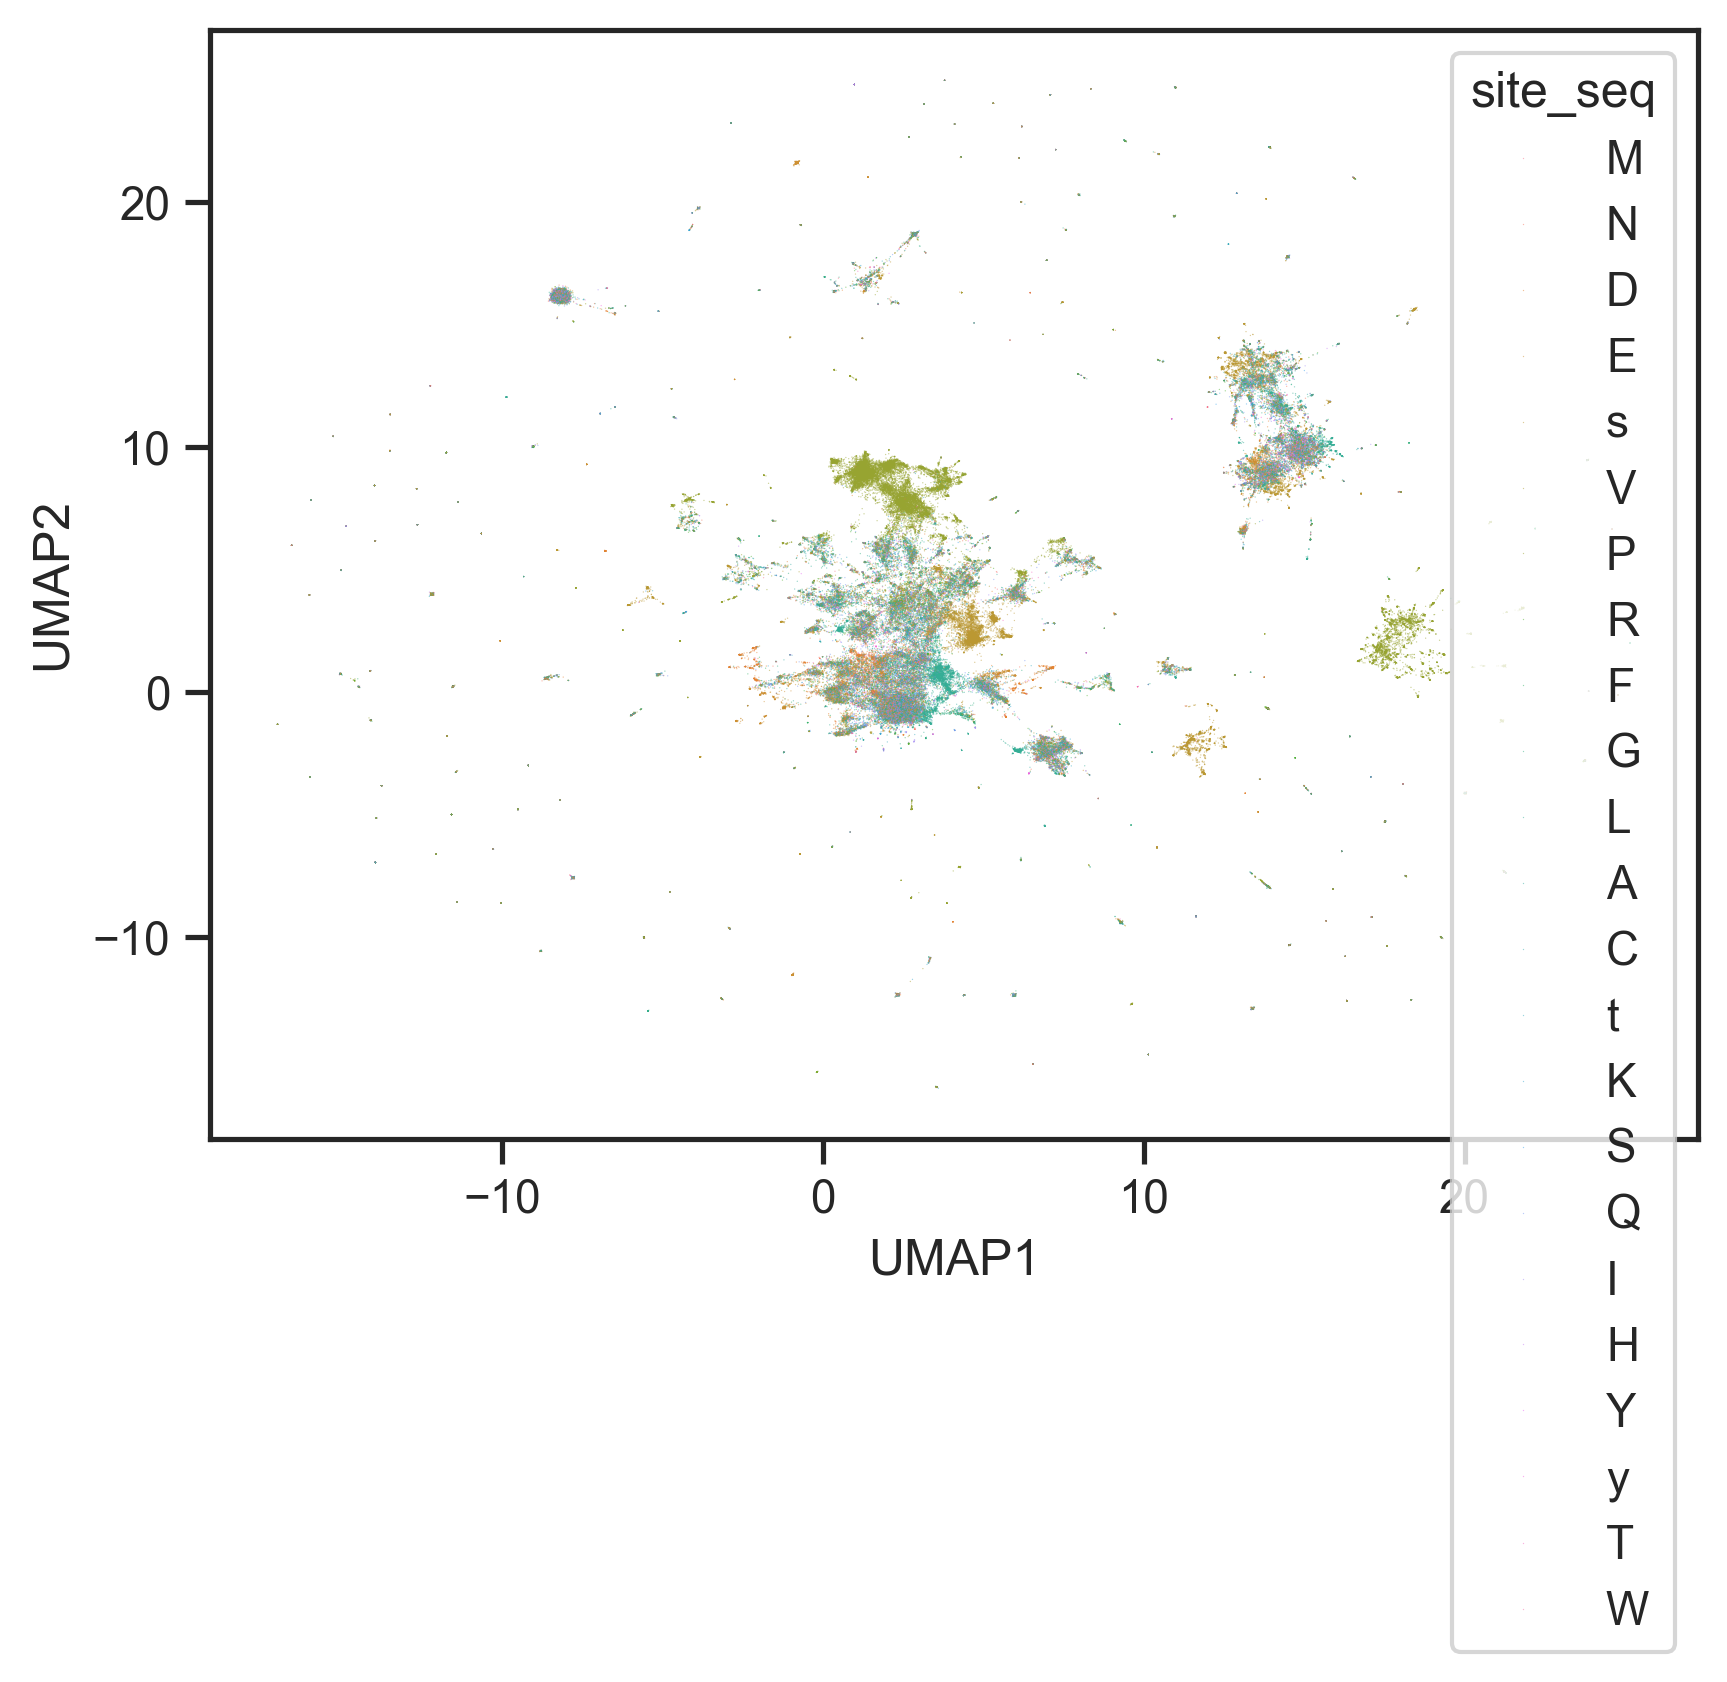
Entropy
from katlas.core import *pspa = Data.get_pspa_all_norm()pspa.index.duplicated(keep=False).sum()np.int64(0)pspa = pspa.dropna(axis=1)entropy??Signature: entropy(pssm_df, return_min=False, exclude_zero=False, contain_sty=True)
Source:
def entropy(pssm_df,# a dataframe of pssm wtih index as aa and column as position
return_min=False, # return min entropy as a single value or return all entropy as a series
exclude_zero=False, # exclude the column of 0 (center position) in the entropy calculation
contain_sty=True, # keep only s,t,y values (last three) in center 0 position
):
"Calculate entropy per position (max) of a PSSM surrounding 0"
pssm_df = pssm_df.copy()
pssm_df.columns= pssm_df.columns.astype(int)
if 0 in pssm_df.columns:
if exclude_zero:
pssm_df = pssm_df.drop(columns=[0])
if contain_sty:
pssm_df.loc[pssm_df.index[:-3], 0] = 0
pssm_df = pssm_df/pssm_df.sum()
per_position = -np.sum(pssm_df * np.log2(pssm_df + 1e-9), axis=0)
return per_position.min() if return_min else per_position
File: f:\git\katlas\katlas\core.py
Type: functionentropy_flat??Signature:
entropy_flat(
flat_pssm: pandas.core.series.Series,
return_min=False,
exclude_zero=False,
contain_sty=True,
)
Source:
def entropy_flat(flat_pssm:pd.Series,return_min=False,exclude_zero=False,contain_sty=True):
"Calculate entropy per position of a flat PSSM surrounding 0"
pssm_df = recover_pssm(flat_pssm)
return entropy(pssm_df,return_min=return_min,exclude_zero=exclude_zero,contain_sty=contain_sty)
File: f:\git\katlas\katlas\core.py
Type: functionentropies = []
ICs = []
for i,r in pspa.iterrows():
entropies.append(entropy_flat(r,return_min=False).to_dict())
ICs.append(get_IC_flat(r).to_dict())entropy_df = pd.DataFrame(entropies,index=pspa.index)
IC_df = pd.DataFrame(ICs,index=pspa.index)entropy_df| -5 | -4 | -3 | -2 | -1 | 0 | 1 | 2 | 3 | 4 | |
|---|---|---|---|---|---|---|---|---|---|---|
| kinase | ||||||||||
| AAK1 | 4.238872 | 4.477492 | 4.419067 | 4.334337 | 4.285531 | 4.430518e-01 | 2.367128 | 4.484580 | 4.459749 | 4.448665 |
| ACVR2A | 4.492276 | 4.483099 | 4.422408 | 3.851257 | 4.450203 | 9.999489e-01 | 4.101970 | 4.509378 | 4.502156 | 4.509964 |
| ACVR2B | 4.480671 | 4.478871 | 4.409857 | 3.939154 | 4.426689 | 9.996887e-01 | 4.074009 | 4.491815 | 4.508044 | 4.505800 |
| AKT1 | 4.427160 | 4.402988 | 3.143867 | 3.590452 | 4.374148 | 9.659053e-01 | 4.334536 | 4.429082 | 4.442455 | 4.412808 |
| AKT2 | 4.427318 | 4.415247 | 2.970578 | 3.821267 | 4.416441 | 9.566125e-01 | 4.467609 | 4.463490 | 4.452789 | 4.435681 |
| ... | ... | ... | ... | ... | ... | ... | ... | ... | ... | ... |
| KDR | 4.491261 | 4.472633 | 4.457427 | 4.448105 | 4.381677 | -1.442695e-09 | 4.390681 | 4.443358 | 4.152800 | 4.462793 |
| FLT4 | 4.511274 | 4.501896 | 4.500559 | 4.504176 | 4.297943 | -1.442695e-09 | 4.290937 | 4.344806 | 4.154417 | 4.498858 |
| WEE1_TYR | 4.507984 | 4.495537 | 4.489914 | 4.470009 | 4.089527 | -1.442695e-09 | 4.284853 | 4.403815 | 4.301392 | 4.426540 |
| YES1 | 4.497127 | 4.491665 | 4.442265 | 4.465032 | 4.274232 | -1.442695e-09 | 4.350331 | 4.485518 | 4.275385 | 4.492019 |
| ZAP70 | 4.355980 | 4.260120 | 4.111361 | 4.128756 | 3.473012 | -1.442695e-09 | 3.634941 | 4.358286 | 4.286572 | 4.474739 |
396 rows × 10 columns
# columns surrounding 0
cols = pspa.columns[~pspa.columns.str.startswith('0')]pspa[cols].max(1).sort_values()kinase
VRK2 0.0941
ROS1 0.0983
TYK2 0.0995
LIMK1_TYR 0.1027
RET 0.1027
...
YANK2 3.7589
GSK3B 3.9147
YANK3 4.2045
CK1A 5.8890
CK1G3 8.4920
Length: 396, dtype: float64def plot_dots(df,ylabel='bits',figsize=(5,3)):
df.columns = df.columns.astype(str)
plt.figure(figsize=figsize)
for i, col in enumerate(df.columns):
x_jitter = np.random.normal(loc=i, scale=0.1, size=len(df))
plt.scatter(x_jitter, df[col], alpha=0.7, s=5,edgecolors='none')
plt.xticks(range(len(df.columns)), df.columns)
plt.xlabel("Position")
plt.ylabel(ylabel)def plot_violin(df, ylabel='bits', figsize=(5, 3)):
df_melted = df.melt(var_name='Position', value_name='Value')
plt.figure(figsize=figsize)
sns.violinplot(x='Position', y='Value', data=df_melted, inner=None, density_norm='width')
sns.stripplot(x='Position', y='Value', data=df_melted, color='k', size=2, jitter=True, alpha=0.5)
plt.xlabel('Position')
plt.ylabel(ylabel)
plt.tight_layout()plot_violin(entropy_df,ylabel='Entropy (bits)')
plt.title('Entropy per Position');
plot_violin(IC_df,ylabel='Information content (bits)')
plt.title('Information Content per Position');plot_dots(IC_df,ylabel='Information Content (bits)')
plt.title('Information Content per Position');
plot_dots(entropy_df,ylabel='Entropy (bits)')
plt.title('Entropy per Position');entropy_df.columnsIndex(['-5', '-4', '-3', '-2', '-1', '0', '1', '2', '3', '4'], dtype='object')entropy_df2 = entropy_df.drop(columns=['0']).copy()entropy_df2.min(1).sort_values().head(20)kinase
CK1G3 1.674890
CK1A 1.825040
YANK3 1.943948
YANK2 2.017911
P38G 2.053687
P38D 2.060065
GSK3B 2.067587
GSK3A 2.108316
CDK17 2.123790
CK1G2 2.148218
CDK3 2.198466
SBK 2.216507
CK1A2 2.221651
ERK7 2.223145
CK1D 2.236495
CDK16 2.255882
AAK1 2.367128
FAM20C 2.400912
CDK18 2.435806
CDK4 2.452885
dtype: float64