from katlas.data import Datapspa
PSPA data visualization
Setup
Plot
preprocess_pspa
def preprocess_pspa(
    pssm
):
Drop row s as it’s a duplicate of t; rename t to pS/pT; calculate np.log2(pssm/pssm.median())
pspa=Data.pspa()

row = pspa.loc['GSK3B']
pssm = recover_pssm(row.dropna())
pssm = preprocess_pspa(pssm)
pssm| Position | -5 | -4 | -3 | -2 | -1 | 0 | 1 | 2 | 3 | 4 |
|---|---|---|---|---|---|---|---|---|---|---|
| aa | ||||||||||
| P | 0.128793 | 0.103768 | 0.327105 | 0.377614 | 0.200697 | 0.000000 | 0.857330 | -0.156606 | -0.022523 | 0.020985 |
| G | 0.267518 | 0.232140 | 0.709128 | 0.215152 | 0.186051 | 0.000000 | -0.070893 | -0.132404 | -0.032647 | -0.138561 |
| A | 0.198756 | 0.026650 | 0.861131 | 0.210679 | 0.040110 | 0.000000 | -0.073537 | 0.007280 | -0.146221 | -0.092757 |
| C | 0.281692 | 0.223789 | 0.041703 | 0.297615 | -0.036342 | 0.000000 | 0.018745 | 0.043140 | 0.002481 | 0.013151 |
| S | 0.000000 | -0.019696 | -0.001366 | -0.016950 | 0.000000 | 5.167707 | -0.001258 | 0.000000 | -0.002485 | -0.013272 |
| T | 0.000000 | -0.019696 | -0.001366 | -0.016950 | 0.000000 | 4.454046 | -0.001258 | 0.000000 | -0.002485 | -0.013272 |
| V | 0.052905 | -0.029645 | 0.009523 | 0.047180 | -0.161873 | 0.000000 | 0.067572 | -0.151192 | -0.154488 | -0.213174 |
| I | 0.000000 | -0.135793 | -0.045760 | 0.094081 | -0.205347 | 0.000000 | 0.065169 | -0.034469 | -0.089637 | -0.222392 |
| L | 0.041050 | -0.054824 | -0.194011 | -0.100647 | -0.161873 | 0.000000 | -0.013903 | -0.019595 | -0.097586 | -0.129861 |
| M | -0.049839 | -0.090829 | -0.012337 | -0.100647 | 0.076869 | 0.000000 | -0.001258 | -0.027013 | 0.100694 | -0.026668 |
| F | 0.071672 | -0.127756 | -0.144893 | -0.145823 | -0.247330 | 0.000000 | -0.049908 | 0.064236 | 0.098376 | -0.092757 |
| Y | -0.007367 | 0.021841 | -0.051406 | -0.160236 | -0.140617 | 0.000000 | -0.192106 | 0.000000 | 0.079700 | 0.114257 |
| W | 0.108489 | 0.059871 | 0.023019 | 0.016753 | -0.091356 | 0.000000 | 0.001257 | 0.007280 | 0.012363 | 0.148034 |
| H | 0.024288 | -0.019696 | -0.026169 | -0.095098 | 0.000000 | 0.000000 | 0.016259 | 0.199623 | 0.161902 | 0.089637 |
| K | -0.032199 | 0.144157 | 0.057528 | 0.237314 | 0.094903 | 0.000000 | 0.067572 | 0.016930 | 0.036774 | 0.082169 |
| R | -0.042252 | 0.080831 | 0.598097 | 0.647946 | 0.049388 | 0.000000 | 0.050669 | 0.054898 | 0.084392 | -0.129861 |
| Q | -0.163205 | -0.090829 | -0.015093 | -0.022206 | 0.083658 | 0.000000 | 0.040921 | 0.112292 | -0.002485 | -0.013272 |
| N | -0.227709 | 0.019431 | 0.001364 | -0.016950 | 0.014284 | 0.000000 | -0.018991 | 0.156618 | -0.007469 | 0.097067 |
| D | -0.271386 | -0.049753 | -0.001366 | -0.040753 | -0.210875 | 0.000000 | -0.238837 | -0.234608 | -0.116305 | 0.015767 |
| E | -0.271386 | -0.238787 | -0.054238 | -0.075844 | -0.261600 | 0.000000 | -0.253757 | -0.137747 | 0.315457 | 1.379934 |
| pS/pT | -0.112011 | 0.206940 | 0.355120 | 0.106174 | -0.114481 | 0.000000 | 0.055519 | -0.004874 | 1.836501 | 6.163857 |
| pY | -0.106727 | 0.196308 | 0.158811 | 0.259140 | 0.699151 | 0.000000 | 0.222213 | 0.047855 | 1.191558 | 1.496894 |
plot_logo_pspa
def plot_logo_pspa(
    row, title:str='Motif', figsize:tuple=(5, 2)
):
Call self as a function.
plot_logo_pspa(pspa.loc['GSK3B'],title='GSK3B')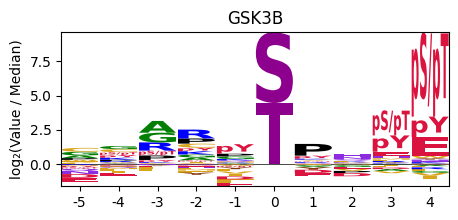
plot_logo_heatmap_pspa
def plot_logo_heatmap_pspa(
    row, # row of Data.pspa()
    title:str='Motif', figsize:tuple=(6, 10), include_zero:bool=False
):
Plot logo and heatmap vertically
plot_logo_heatmap_pspa(pspa.loc['GSK3B'],title='GSK3B')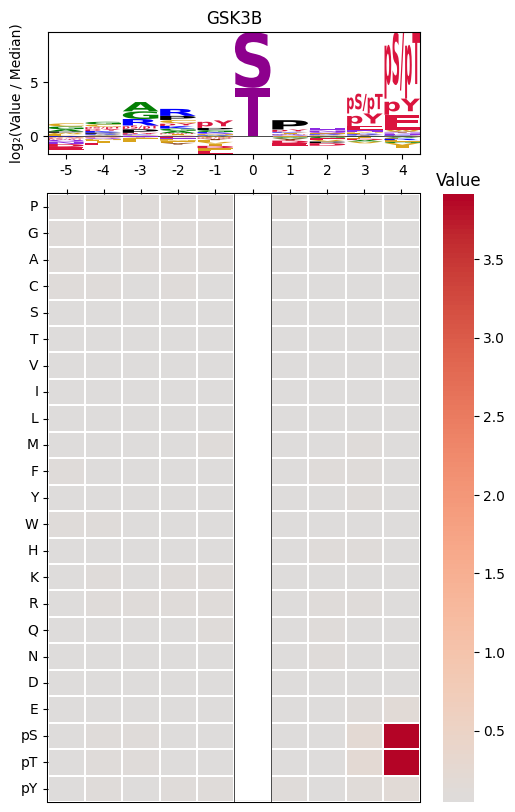
Others (old version)
raw2norm
def raw2norm(
    df:DataFrame, # single kinase's df has position as index, and single amino acid as columns
    PDHK:bool=False, # whether this kinase belongs to PDHK family
):
Normalize single ST kinase data
This function implement the normalization method from Johnson et al. Nature: An atlas of substrate specificities for the human serine/threonine kinome
Specifically, > - matrices were column-normalized at all positions by the sum of the 17 randomized amino acids (excluding serine, threonine and cysteine), to yield PSSMs. >- PDHK1 and PDHK4 were normalized to the 16 randomized amino acids (excluding serine, threonine, cysteine and additionally tyrosine) >- The cysteine row was scaled by its median to be 1/17 (1/16 for PDHK1 and PDHK4). >- The serine and threonine values in each position were set to be the median of that position. >- The S0/T0 ratio was determined by summing the values of S and T rows in the matrix (SS and ST, respectively), accounting for the different S vs. T composition of the central (1:1) and peripheral (only S or only T) positions (Sctrl and Tctrl, respectively), and then normalizing to the higher value among the two (S0 and T0, respectively, Supplementary Note 1)
This function is usually implemented with the below function, with normalize being a bool argument.
get_one_kinase
def get_one_kinase(
    df:DataFrame, # stacked dataframe (paper's raw data)
    kinase:str, # a specific kinase
    normalize:bool=False, # normalize according to the paper; special for PDHK1/4
    drop_s:bool=True, # drop s as s is a duplicates of t in PSPA
):
Obtain a specific kinase data from stacked dataframe
Retreive a single kinase data from PSPA data that has an format of kinase as index and position+amino acid as column.
data = Data.pspa_st()get_one_kinase(data,'PDHK1')| aa | A | C | D | E | F | G | H | I | K | L | ... | P | Q | R | S | T | V | W | Y | t | y |
|---|---|---|---|---|---|---|---|---|---|---|---|---|---|---|---|---|---|---|---|---|---|
| position | |||||||||||||||||||||
| -5 | 0.0594 | 0.0625 | 0.0589 | 0.0550 | 0.0775 | 0.0697 | 0.0687 | 0.0590 | 0.0515 | 0.0657 | ... | 0.0451 | 0.0424 | 0.0594 | 0.0594 | 0.0594 | 0.0573 | 0.1001 | 0.0775 | 0.0583 | 0.0658 |
| -4 | 0.0618 | 0.0621 | 0.0550 | 0.0511 | 0.0739 | 0.0715 | 0.0598 | 0.0601 | 0.0520 | 0.0614 | ... | 0.0637 | 0.0552 | 0.0617 | 0.0608 | 0.0608 | 0.0519 | 0.0916 | 0.0739 | 0.0528 | 0.0752 |
| -3 | 0.0608 | 0.0576 | 0.0499 | 0.0423 | 0.0803 | 0.0580 | 0.0674 | 0.0687 | 0.0481 | 0.0667 | ... | 0.0570 | 0.0532 | 0.0532 | 0.0584 | 0.0584 | 0.0588 | 0.1113 | 0.0803 | 0.0416 | 0.0553 |
| -2 | 0.0587 | 0.0655 | 0.0470 | 0.0437 | 0.0790 | 0.0890 | 0.0787 | 0.0533 | 0.0440 | 0.0637 | ... | 0.0500 | 0.0543 | 0.0616 | 0.0565 | 0.0565 | 0.0519 | 0.1082 | 0.0790 | 0.0327 | 0.0557 |
| -1 | 0.0782 | 0.1009 | 0.0989 | 0.0426 | 0.0650 | 0.0695 | 0.0782 | 0.0496 | 0.0409 | 0.0578 | ... | 0.0540 | 0.0500 | 0.0469 | 0.0594 | 0.0594 | 0.0514 | 0.0756 | 0.0650 | 0.0358 | 0.0433 |
| 0 | NaN | NaN | NaN | NaN | NaN | NaN | NaN | NaN | NaN | NaN | ... | NaN | NaN | NaN | 1.0000 | 0.4886 | NaN | NaN | 0.0000 | 0.4886 | 0.0000 |
| 1 | 0.0400 | 0.0562 | 0.0394 | 0.0355 | 0.0735 | 0.0400 | 0.0502 | 0.1288 | 0.0390 | 0.1439 | ... | 0.0379 | 0.0455 | 0.0455 | 0.0455 | 0.0455 | 0.0797 | 0.0784 | 0.0735 | 0.0336 | 0.0452 |
| 2 | 0.0496 | 0.0783 | 0.0643 | 0.0555 | 0.0720 | 0.1067 | 0.0684 | 0.0480 | 0.0505 | 0.0555 | ... | 0.0564 | 0.0653 | 0.0695 | 0.0601 | 0.0601 | 0.0508 | 0.0672 | 0.0720 | 0.0414 | 0.0594 |
| 3 | 0.0486 | 0.0609 | 0.0938 | 0.0684 | 0.1024 | 0.0676 | 0.0544 | 0.0583 | 0.0388 | 0.0552 | ... | 0.0686 | 0.0502 | 0.0561 | 0.0588 | 0.0588 | 0.0593 | 0.0641 | 0.1024 | 0.0539 | 0.0431 |
| 4 | 0.0565 | 0.0749 | 0.0631 | 0.0535 | 0.0732 | 0.0655 | 0.0664 | 0.0625 | 0.0496 | 0.0552 | ... | 0.0677 | 0.0553 | 0.0604 | 0.0626 | 0.0626 | 0.0579 | 0.0864 | 0.0732 | 0.0548 | 0.0575 |
10 rows × 22 columns
get_logo
def get_logo(
    df:DataFrame, # stacked Dataframe with kinase as index, substrates as columns
    kinase:str, # a specific kinase name in index
):
Given stacked df (index as kinase, columns as substrates), get a specific kinase’s logo
This function is to replicate the motif logo from Johnson et al. Nature: An atlas of substrate specificities for the human serine/threonine kinome. Given raw PSPA data, it can output a motif logo.
# load raw PSPA data
# df = pd.read_csv('https://github.com/sky1ove/katlas_raw/raw/refs/heads/main/nbs/raw/pspa_st_raw.csv').set_index('kinase')
# df.head()
# get_logo(df, 'AAK1')