# katlas
from katlas.core import *
# from katlas.plot import plot_rank, set_sns

# utils
import pandas as pd, numpy as np, seaborn as sns
from matplotlib import pyplot as plt
from functools import reduce, partial
from tqdm import tqdm

# statistics
from scipy.stats import ttest_rel,ttest_ind
from statsmodels.stats.multitest import multipletests

# disable warning
import warnings
warnings.filterwarnings("ignore", message="converting a masked element to nan")

pd.set_option('display.precision', 15)Kinase enrichment analysis - AKTi
![]()
In this session, we will analyze the differential change of phosphorylation sites in phosphoproteomics dataset.
Setup
Run below to install:
!pip install python-katlasData
The phosphoproteomics dataset is from paper Chemical Phosphoproteomics Sheds New Light on the Targets and Modes of Action of AKT Inhibitors; five clinical AKT inhibitors are evaluated in this study.

df = pd.read_csv('https://github.com/sky1ove/katlas_raw/raw/refs/heads/main/nbs/raw/AKT_inhibitor.csv')df.head()| gene_site | site_seq | Control_R1 | Control_R2 | Control_R3 | Control_R4 | AZD5363_R1 | AZD5363_R2 | AZD5363_R3 | AZD5363_R4 | ... | GSK690693_R3 | GSK690693_R4 | Ipatasertib_R1 | Ipatasertib_R2 | Ipatasertib_R3 | Ipatasertib_R4 | MK-2206_R1 | MK-2206_R2 | MK-2206_R3 | MK-2206_R4 | |
|---|---|---|---|---|---|---|---|---|---|---|---|---|---|---|---|---|---|---|---|---|---|
| 0 | AAK1_S637 | AGHRRILsDVtHsAV | 14.167260000000001 | 13.791940000000000 | 13.888430000000000 | 13.991310000000000 | 14.581049999999999 | 14.802630000000001 | 14.723060000000000 | 14.857880000000000 | ... | 14.47591 | 14.810269999999999 | 14.541550000000001 | 14.598560000000001 | 14.669480000000000 | 14.267690000000000 | 14.500560000000000 | 14.700110000000000 | 14.642170000000000 | 14.394790000000000 |
| 1 | ABCF1_S105 | MERLKKLsVPtsDEE | 14.184260000000000 | 14.422390000000000 | 14.320520000000000 | 14.310689999999999 | 14.905970000000000 | 15.157950000000000 | 14.848050000000001 | 14.968950000000000 | ... | 14.82788 | 14.924620000000001 | 14.888140000000000 | 15.019850000000000 | 14.857740000000000 | 14.809049999999999 | 14.915050000000001 | 14.815270000000000 | 15.067920000000001 | 14.526149999999999 |
| 2 | ACIN1_S208 | HSPRKSSsIsEEKGD | 15.956730000000000 | 15.791060000000000 | NaN | 15.961280000000000 | 14.763690000000000 | 14.926340000000000 | NaN | 14.933990000000000 | ... | NaN | 14.728800000000000 | 15.004510000000000 | 14.969420000000000 | NaN | 14.797020000000000 | 14.923180000000000 | 15.012650000000001 | NaN | 15.046220000000000 |
| 3 | ACIN1_S216 | IsEEKGDsDDEKPRK | 17.457689999999999 | 16.997420000000002 | 17.373349999999999 | 17.434950000000001 | 16.252500000000001 | 16.341049999999999 | 16.316970000000001 | 16.411560000000001 | ... | 16.38372 | 16.193570000000001 | 16.486070000000002 | 16.445869999999999 | 16.275169999999999 | 16.242329999999999 | 16.405529999999999 | 16.500750000000000 | 16.558160000000001 | 16.533030000000000 |
| 4 | ACIN1_S240 | QARAAkLsEGsQPAE | 13.211040000000001 | 13.129730000000000 | 13.565530000000001 | 13.572440000000000 | 12.127129999999999 | 12.011320000000000 | 12.125540000000001 | 11.806080000000000 | ... | 12.09775 | 12.322410000000000 | 11.838360000000000 | 12.090270000000000 | 12.027799999999999 | 11.561370000000000 | 12.093400000000001 | 12.152469999999999 | 12.159110000000000 | 11.888489999999999 |
5 rows × 26 columns
df.columnsIndex(['gene_site', 'site_seq', 'Control_R1', 'Control_R2', 'Control_R3',
'Control_R4', 'AZD5363_R1', 'AZD5363_R2', 'AZD5363_R3', 'AZD5363_R4',
'GSK2110183_R1', 'GSK2110183_R2', 'GSK2110183_R3', 'GSK2110183_R4',
'GSK690693_R1', 'GSK690693_R2', 'GSK690693_R3', 'GSK690693_R4',
'Ipatasertib_R1', 'Ipatasertib_R2', 'Ipatasertib_R3', 'Ipatasertib_R4',
'MK-2206_R1', 'MK-2206_R2', 'MK-2206_R3', 'MK-2206_R4'],
dtype='object')ctrl = df.columns[df.columns.str.contains('Control')]
# below are five AKT inhibitors
AZD = df.columns[df.columns.str.contains('AZD5363')]
GSK2 = df.columns[df.columns.str.contains('GSK2110183')]
GSK6 = df.columns[df.columns.str.contains('GSK690693')]
ipa = df.columns[df.columns.str.contains('Ipatasertib')]
MK = df.columns[df.columns.str.contains('MK')]Statistical test
Let’s use AZD for example:
azd = get_pvalue(df,ctrl, AZD,'mann_whitney')Computing mann_whitney tests: 100%|██████████| 10900/10900 [00:05<00:00, 1894.69it/s]azd.head()| log2FC | p_value | p_adj | signed_logP | signed_logPadj | |
|---|---|---|---|---|---|
| 0 | 0.822975000000001 | 0.028571428571429 | 0.186595908585124 | 1.544068044350276 | 0.729097883088899 |
| 1 | 0.621855000000000 | 0.028571428571429 | 0.186595908585124 | 1.544068044350276 | 0.729097883088899 |
| 2 | -1.030390000000001 | 0.100000000000000 | 0.314892387693197 | -1.000000000000000 | -0.501837838006831 |
| 3 | -1.075140000000001 | 0.028571428571429 | 0.186595908585124 | -1.544068044350276 | -0.729097883088899 |
| 4 | -1.319855000000000 | 0.028571428571429 | 0.186595908585124 | -1.544068044350276 | -0.729097883088899 |
azd.p_value.sort_values()92 0.028571428571429
94 0.028571428571429
34 0.028571428571429
36 0.028571428571429
38 0.028571428571429
...
10899 1.000000000000000
10841 1.000000000000000
297 1.000000000000000
10898 1.000000000000000
10864 1.000000000000000
Name: p_value, Length: 10900, dtype: float64As the sample size for calculating p value is small in this case, we will use uncorrected p_value to allow more data to be considered; it is more important to look at the effect size
info = df.iloc[:,:2]azd = pd.concat([info,azd],axis=1)Cut through threshold
# set a threshold of 0.05 for p_value
azd2 = azd[azd.p_value<0.05].reset_index(drop=True)azd2.shape(1669, 7)azd2.site_seq.str[7].value_counts().plot.bar();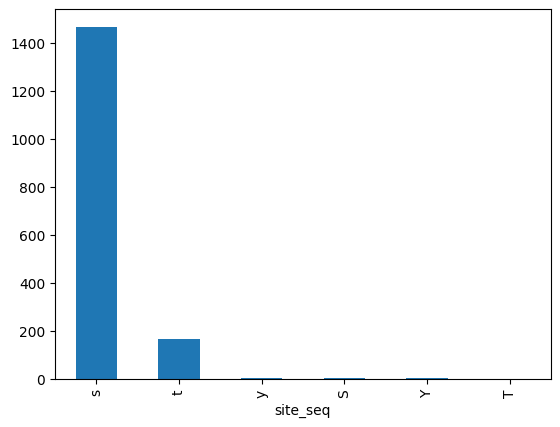
Visualize fold change values
def plot_value(df,col):
    plt.figure(figsize=(10, 5))

    # sort values
    df=df.copy().sort_values(col).reset_index(drop=True)

    plt.fill_between(df.index, df[col], where=(df[col] >= 0), color='blue', alpha=0.3, label='Positive')
    plt.fill_between(df.index, df[col], where=(df[col] <= 0), color='red', alpha=0.3, label='Negative')
    plt.title('Area Plot of Values')
    plt.xlabel('Ranked Index')
plt.ylabel('Values')plot_value(azd2,'log2FC')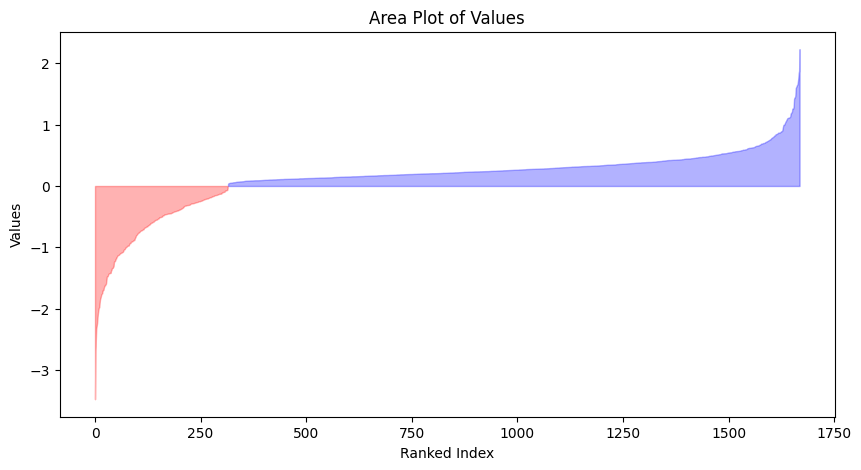
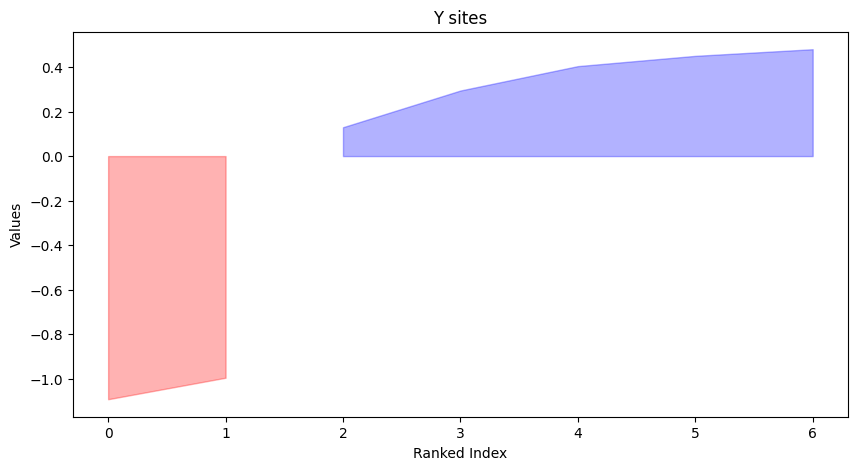
st_sites = azd2[azd2.site_seq.str[7].str.upper()!='Y']
y_sites = azd2[azd2.site_seq.str[7].str.upper()=='Y']plot_value(st_sites,'log2FC')
plt.title('S/T sites')
plot_value(y_sites,'log2FC')
plt.title('Y sites')Text(0.5, 1.0, 'Y sites')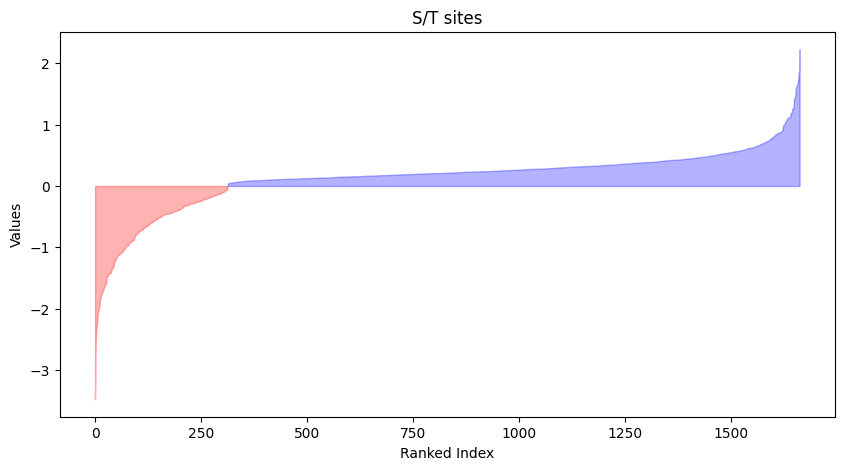
Dataset processing
There are NaNs in site_seq, we will drop them
azd2=azd2.dropna(subset='site_seq')Some site_seq contains multiple sequences splitted by “;”, we will take the first one.
azd2['site_seq2'] = azd2.site_seq.str.split(';').str[0]Make sure site sequence length are all consistent
azd2['len'] = azd2.site_seq2.str.len()azd2.len.value_counts()len
15 1647
Name: count, dtype: int64azd2['acceptor'] = azd2.site_seq2.str[7]Substrate scoring
pspa_out = predict_kinase_df(azd2,seq_col='site_seq2', **Params('PSPA'))
cddm_out = predict_kinase_df(azd2,seq_col='site_seq2', **Params('CDDM'))
input dataframe has a length 1647
Preprocessing
Finish preprocessing
Merging reference
Finish merging100%|██████████| 396/396 [00:01<00:00, 327.83it/s]input dataframe has a length 1647
Preprocessing
Finish preprocessing
Merging reference
Finish mergingKinase enrichment
def get_enrichment(score_df, # output df of predict_kinase_df
                    site_df, # df that contains site sequence
                    weight_col, # column that indicates direction (sign) and weights for the site
                    is_Y=False, # whether or not it is Y site or S/T site
                    top_n = 5, # top n kinase to consider for each site
                                  ):

    "Calculate kinase enrichment score for sites with signed log10(p) that pass a threshold(1.3) "

    if is_Y:
        idx_up = site_df.index[(site_df.acceptor.str.upper()=="Y") & (site_df[weight_col]>0)]
        idx_dn = site_df.index[(site_df.acceptor.str.upper()=="Y") & (site_df[weight_col]<0)]
    else:
        idx_up = site_df.index[(site_df.acceptor.str.upper()!="Y") & (site_df[weight_col]>0)]
        idx_dn = site_df.index[(site_df.acceptor.str.upper()!="Y") & (site_df[weight_col]<0)]

    up_site = site_df.loc[idx_up]
    dn_site = site_df.loc[idx_dn]

    up_score = score_df.loc[idx_up]
    dn_score = score_df.loc[idx_dn]

    def top_kinases(site_row,top_n=5):
        # Sort the row in descending order and get the top n kinases
        top_kinases = site_row.sort_values(ascending=False).head(top_n)

        # Get the counts of the top kinases
        kinase_counts = top_kinases.index.value_counts()

        return kinase_counts

    func = partial(top_kinases,top_n=top_n)

    up_cnt = up_score.apply(func,axis=1)
    dn_cnt = dn_score.apply(func,axis=1)

    df_up_cnt = up_cnt.sum().reset_index(name = 'up_cnt')
    df_dn_cnt = dn_cnt.sum().reset_index(name = 'dn_cnt')

    df_w_up = up_cnt.multiply(abs(up_site[weight_col]),axis=0).sum().reset_index(name = 'up_weighted_cnt')
    df_w_dn = dn_cnt.multiply(abs(dn_site[weight_col]),axis=0).sum().reset_index(name = 'dn_weighted_cnt')

    dfs = [df_up_cnt,df_dn_cnt,df_w_up,df_w_dn]

    result = reduce(lambda left, right: pd.merge(left, right, how='outer'), dfs)

    result = result.fillna(0)
    result['max'] = result.apply(lambda r: r.up_weighted_cnt if r.up_weighted_cnt >= r.dn_weighted_cnt else -r.dn_weighted_cnt,axis=1)
    result['delta'] = result.up_weighted_cnt - result.dn_weighted_cnt
    result = result.rename(columns={'index':'kinase'})

    return result
As we only have 6 y sites, we will do S/T sites kinase enrichment; setis_Y to False
st_cddm = get_enrichment(cddm_out,azd2,'log2FC',is_Y=False,top_n=10)
st_pspa = get_enrichment(pspa_out,azd2,'log2FC',is_Y=False,top_n=10)st_cddm.head()| kinase | up_cnt | dn_cnt | up_weighted_cnt | dn_weighted_cnt | max | delta | |
|---|---|---|---|---|---|---|---|
| 0 | ACVR2A | 16.0 | 2.0 | 4.321139999999996 | 0.387275000000001 | 4.321139999999996 | 3.933864999999996 |
| 1 | AKT1 | 115.0 | 130.0 | 37.703091500000035 | 110.405810000000002 | -110.405810000000002 | -72.702718499999975 |
| 2 | AKT2 | 13.0 | 78.0 | 3.840655000000002 | 75.697464999999994 | -75.697464999999994 | -71.856809999999996 |
| 3 | AKT3 | 79.0 | 110.0 | 25.234140000000036 | 100.077135000000027 | -100.077135000000027 | -74.842994999999988 |
| 4 | ALK2 | 90.0 | 11.0 | 21.950408500000012 | 5.124545000000005 | 21.950408500000012 | 16.825863500000008 |
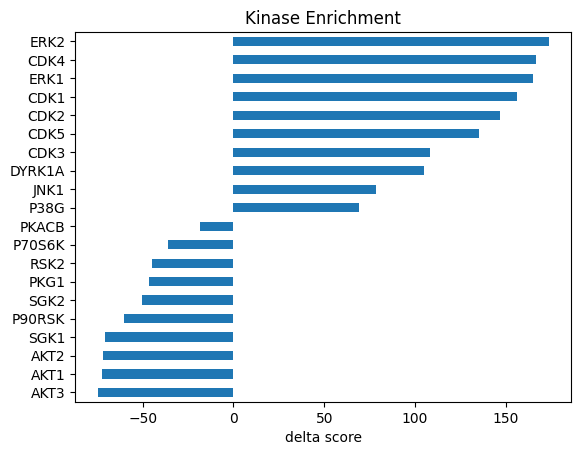
Delta is the difference between up_weighted_cnt and dn_weighted_cnt vaue, max is the maximum value among the two.
st_cddm.sort_values('delta')| kinase | up_cnt | dn_cnt | up_weighted_cnt | dn_weighted_cnt | max | delta | |
|---|---|---|---|---|---|---|---|
| 3 | AKT3 | 79.0 | 110.0 | 25.234140000000036 | 100.077135000000027 | -100.077135000000027 | -74.842994999999988 |
| 1 | AKT1 | 115.0 | 130.0 | 37.703091500000035 | 110.405810000000002 | -110.405810000000002 | -72.702718499999975 |
| 2 | AKT2 | 13.0 | 78.0 | 3.840655000000002 | 75.697464999999994 | -75.697464999999994 | -71.856809999999996 |
| 159 | SGK1 | 74.0 | 110.0 | 24.613551500000032 | 95.519774999999996 | -95.519774999999996 | -70.906223499999967 |
| 122 | P90RSK | 166.0 | 149.0 | 58.454870500000020 | 118.607010000000017 | -118.607010000000017 | -60.152139499999997 |
| ... | ... | ... | ... | ... | ... | ... | ... |
| 27 | CDK2 | 610.0 | 70.0 | 185.843078500000047 | 38.980064500000012 | 185.843078500000047 | 146.863014000000021 |
| 26 | CDK1 | 662.0 | 84.0 | 202.509342000000004 | 46.487524500000013 | 202.509342000000004 | 156.021817499999997 |
| 52 | ERK1 | 666.0 | 76.0 | 205.446255000000036 | 40.366904500000004 | 205.446255000000036 | 165.079350500000032 |
| 29 | CDK4 | 691.0 | 83.0 | 210.494168500000001 | 43.878864500000013 | 210.494168500000001 | 166.615303999999981 |
| 53 | ERK2 | 713.0 | 84.0 | 217.655180000000030 | 44.031049499999995 | 217.655180000000030 | 173.624130500000035 |
177 rows × 7 columns
st_cddm.sort_values('max')| kinase | up_cnt | dn_cnt | up_weighted_cnt | dn_weighted_cnt | max | delta | |
|---|---|---|---|---|---|---|---|
| 152 | PRKX | 293.0 | 157.0 | 107.897737000000006 | 124.321542000000051 | -124.321542000000051 | -16.423805000000044 |
| 122 | P90RSK | 166.0 | 149.0 | 58.454870500000020 | 118.607010000000017 | -118.607010000000017 | -60.152139499999997 |
| 1 | AKT1 | 115.0 | 130.0 | 37.703091500000035 | 110.405810000000002 | -110.405810000000002 | -72.702718499999975 |
| 3 | AKT3 | 79.0 | 110.0 | 25.234140000000036 | 100.077135000000027 | -100.077135000000027 | -74.842994999999988 |
| 159 | SGK1 | 74.0 | 110.0 | 24.613551500000032 | 95.519774999999996 | -95.519774999999996 | -70.906223499999967 |
| ... | ... | ... | ... | ... | ... | ... | ... |
| 27 | CDK2 | 610.0 | 70.0 | 185.843078500000047 | 38.980064500000012 | 185.843078500000047 | 146.863014000000021 |
| 26 | CDK1 | 662.0 | 84.0 | 202.509342000000004 | 46.487524500000013 | 202.509342000000004 | 156.021817499999997 |
| 52 | ERK1 | 666.0 | 76.0 | 205.446255000000036 | 40.366904500000004 | 205.446255000000036 | 165.079350500000032 |
| 29 | CDK4 | 691.0 | 83.0 | 210.494168500000001 | 43.878864500000013 | 210.494168500000001 | 166.615303999999981 |
| 53 | ERK2 | 713.0 | 84.0 | 217.655180000000030 | 44.031049499999995 | 217.655180000000030 | 173.624130500000035 |
177 rows × 7 columns
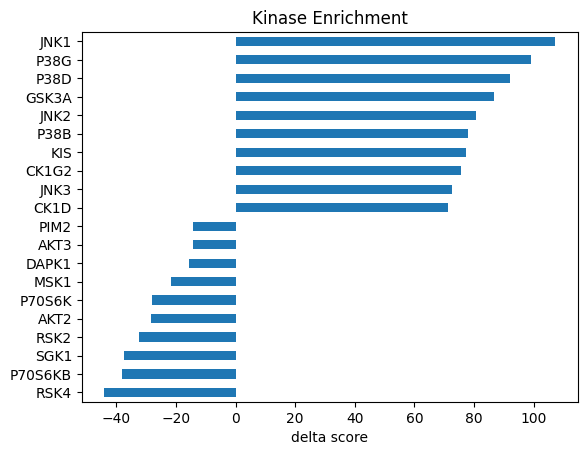
Visualize in bar graph
def get_bar_data(df, score_col, top_n = 10, plot=True):

    data = df.sort_values(score_col)[['kinase',score_col]]

    data.columns = ['Kinase','Score']

    data = pd.concat([data.head(top_n),data.tail(top_n)]).set_index('Kinase')

    if plot:
        data.plot.barh(legend=False)
        plt.title('Kinase Enrichment')
        plt.xlabel(f'{score_col} score')
        plt.ylabel('')

    return data
bar_cddm = get_bar_data(st_cddm,'delta')
bar_pspa = get_bar_data(st_pspa,'delta')