import pandas as pd
import numpy as np
from katlas.data import *
from katlas.pssm import *
from katlas.utils import *
from katlas.plot import *
from katlas.feature import *
from matplotlib import pyplot as plt
import seaborn as sns
import math

from sklearn.cluster import KMeansPlot heatmap and logo of CDDM
Setup
df = Data.get_ks_dataset()df.head()| kin_sub_site | kinase_uniprot | substrate_uniprot | site | source | substrate_genes | substrate_phosphoseq | position | site_seq | sub_site | substrate_sequence | kinase_on_tree | kinase_genes | kinase_group | kinase_family | kinase_pspa_big | kinase_pspa_small | kinase_coral_ID | num_kin | |
|---|---|---|---|---|---|---|---|---|---|---|---|---|---|---|---|---|---|---|---|
| 0 | O00141_A4FU28_S140 | O00141 | A4FU28 | S140 | Sugiyama | CTAGE9 | MEEPGATPQPYLGLVLEELGRVVAALPESMRPDENPYGFPSELVVC... | 140 | AAAEEARSLEATCEKLSRsNsELEDEILCLEKDLKEEKSKH | A4FU28_S140 | MEEPGATPQPYLGLVLEELGRVVAALPESMRPDENPYGFPSELVVC... | 1 | SGK1 SGK | AGC | SGK | Basophilic | Akt/rock | SGK1 | 22 |
| 1 | O00141_O00141_S252 | O00141 | O00141 | S252 | Sugiyama | SGK1 SGK | MTVKTEAAKGTLTYSRMRGMVAILIAFMKQRRMGLNDFIQKIANNS... | 252 | SQGHIVLTDFGLCKENIEHNsTtstFCGtPEyLAPEVLHKQ | O00141_S252 | MTVKTEAAKGTLTYSRMRGMVAILIAFMKQRRMGLNDFIQKIANNS... | 1 | SGK1 SGK | AGC | SGK | Basophilic | Akt/rock | SGK1 | 1 |
| 2 | O00141_O00141_S255 | O00141 | O00141 | S255 | Sugiyama | SGK1 SGK | MTVKTEAAKGTLTYSRMRGMVAILIAFMKQRRMGLNDFIQKIANNS... | 255 | HIVLTDFGLCKENIEHNsTtstFCGtPEyLAPEVLHKQPYD | O00141_S255 | MTVKTEAAKGTLTYSRMRGMVAILIAFMKQRRMGLNDFIQKIANNS... | 1 | SGK1 SGK | AGC | SGK | Basophilic | Akt/rock | SGK1 | 1 |
| 3 | O00141_O00141_S397 | O00141 | O00141 | S397 | Sugiyama | SGK1 SGK | MTVKTEAAKGTLTYSRMRGMVAILIAFMKQRRMGLNDFIQKIANNS... | 397 | sGPNDLRHFDPEFTEEPVPNsIGKsPDsVLVTAsVKEAAEA | O00141_S397 | MTVKTEAAKGTLTYSRMRGMVAILIAFMKQRRMGLNDFIQKIANNS... | 1 | SGK1 SGK | AGC | SGK | Basophilic | Akt/rock | SGK1 | 1 |
| 4 | O00141_O00141_S404 | O00141 | O00141 | S404 | Sugiyama | SGK1 SGK | MTVKTEAAKGTLTYSRMRGMVAILIAFMKQRRMGLNDFIQKIANNS... | 404 | HFDPEFTEEPVPNsIGKsPDsVLVTAsVKEAAEAFLGFsYA | O00141_S404 | MTVKTEAAKGTLTYSRMRGMVAILIAFMKQRRMGLNDFIQKIANNS... | 1 | SGK1 SGK | AGC | SGK | Basophilic | Akt/rock | SGK1 | 1 |
df.shape(187066, 19)logo heatmap
df['kinase_uniprot_gene'] = df['kinase_uniprot']+'_'+df['kinase_genes'].str.split(' ').str[0]

cnt = df.kinase_uniprot_gene.value_counts()
# cnt = df.kinase_coral_ID.value_counts()def convert_source(x):
if x == "Sugiyama":
return x
elif 'Sugiyama' in x and '|' in x:
return 'Both'
elif 'Sugiyama' not in x:
return 'Non-Sugiyama'df['source_combine'] = df.source.apply(convert_source)def plot_hist_num_kin(df_k):
"Plot histogram of num kin grouped by source_combine."
g = sns.displot(
df_k,
x="num_kin",
col="source_combine",
bins=100,
col_wrap=1,
height=2.0,
aspect=4,
facet_kws={'sharex': False, 'sharey': False}
)
g.set_axis_labels("Number of Kinases per Site", "Count")
# Customize titles
for ax, source in zip(g.axes.flatten(), g.col_names):
count = df_k[df_k['source_combine'] == source].shape[0]
ax.set_title(f"{source} (n={count:,})")
g.figure.suptitle("Histogram of # Kinases per Substrate Site")
# Adjust layout to make room for suptitle
plt.tight_layout()def plot_cnt_cddm(df_k):
"Plot source combine counts via bar graph."
source_cnt = df_k.source_combine.value_counts()
plot_cnt(source_cnt)
plt.title('# Substrate Sites per Source',pad=20)# plot_cnt_cddm(df_k)def plot_cnt_acceptor(df_k):
"Plot site type via bar graph."
acceptor_cnt = df_k.acceptor.value_counts()
plot_cnt(acceptor_cnt)
plt.title('# Substrate Sites per Phospho-Acceptor Type',pad=20)# plot_cnt_acceptor(df_k)# set_sns()# onehot = onehot_encode(df_k.site_seq)def kmeans(onehot,n=2,seed=42):
kmeans = KMeans(n_clusters=n, random_state=seed,n_init='auto')
return kmeans.fit_predict(onehot)def filter_range_columns(df,low=-10,high=10):
positions = df.columns.str[:-1].astype(int)
mask = (positions >= low) & (positions <= high)
return df.loc[:,mask]# positions = onehot.columns.str[:-1].astype(int)
# mask = (positions >= -10) & (positions <= 10)
# onehot = onehot.loc[:,mask]
# df_k['cluster'] = kmeans(onehot,n=10,seed=42)
# pssms = get_cluster_pssms(df_k,'cluster',valid_thr=0.5)
# kmeans_cnt = df_k.cluster.value_counts()# plot_logos(pssms,kmeans_cnt)def get_onehot_add_cluster(df_k,n=10):
df_k = df_k.copy()
onehot = onehot_encode(df_k.site_seq)
onehot_10 = filter_range_columns(onehot)
df_k['Cluster'] = kmeans(onehot_10,n=n,seed=42)
df_k = df_k.reset_index(drop=True)
return df_k,onehot_10# df_k,onehot_10 = get_onehot_add_cluster(df_k,n=10)def get_kmeans_logos(df_k,cnt_thr=10):
pssms = get_cluster_pssms(df_k,'Cluster',valid_thr=0) # remove valid thr
kmeans_cnt = df_k['Cluster'].value_counts()
# filter cluster with >=10 counts
valid_clusters = kmeans_cnt[kmeans_cnt >= cnt_thr].index
filtered_pssms = pssms.loc[valid_clusters]
if not filtered_pssms.empty: plot_logos(filtered_pssms,kmeans_cnt)# df_k,onehot_10 = get_onehot_add_cluster(df_k,n=10)
# get_kmeans_logos(df_k)def plot_onehot(onehot_10,hue):
plot_cluster(onehot_10,'pca',seed=42,complexity=30,hue=hue,legend=True,s=8)
plt.title(f'PCA of One-Hot Encoded\n Substrate Site Sequences (n={len(onehot_10):,})')# df_k,onehot_10 = get_onehot_add_cluster(df_k,n=10)
# plot_onehot(onehot_10,df_k['Cluster'])
# get_kmeans_logos(df_k)# plot_cluster(onehot_10,'pca',seed=42,complexity=30,hue=df_k.cluster,legend=True,s=8)
# plt.title('PCA of One-Hot Encoded Sequences (-10 to +10')# plot_logo_heatmap(pssm_df,title=f'{k} (n={len(df_k):,})',figsize=(17,10))# for site_type in ['S','T','Y']:
# df_sty = df[df.kinase_uniprot_gene.upper()==site_type].copy()
# pssm_sty = get_prob(df_sty,'site_seq')
# plot_logo_heatmap(pssm_sty,title=f'{site_type} sites (n={len(df_sty):,})',figsize=(17,10))
# save_show()# pssm_LO = get_pssm_LO(pssm_sty,'S')# plot_logo_raw(pssm_LO,ytitle="Log-Odds Score (bits)")# plot_logo_heatmap_enrich(pssm_LO)# import logomaker# for site_type in ['S','T','Y']:
# df_sty = df_k[df_k.acceptor.str.upper()==site_type].copy()
# pssm_sty = get_prob(df_sty,'site_seq')
# plot_logo_heatmap(pssm_sty,title=f'{site_type} sites (n={len(df_sty):,})',figsize=(17,10))
# save_show()
# breakIterate
df['acceptor']=df.site.str[0]SHOW=Falsefilter_cnt = cnt[cnt>=40]list(filter_cnt.index).index('O43353_RIPK2')301for k in filter_cnt.index[301:]: breakk'O43353_RIPK2'filter_cnt = cnt[cnt>=40]
for k in filter_cnt.index[301:]:
# for k in ['P00519_ABL1']:
df_k = df[df.kinase_uniprot_gene==k].copy()
# df_k = df_k[df_k.num_kin>10]
# Freq PSSM
pssm_df = get_prob(df_k,'site_seq')
plot_logo_heatmap(pssm_df,title=f'{k} (n={len(df_k):,})',figsize=(17,10))
path1=get_path('~/img/cddm/pssm_freq',f'{k}.svg')
save_show(path1,show_only=SHOW)
# Log odds PSSM
pssm_LO = get_pssm_LO(pssm_df,'STY')
plot_logo_heatmap_LO(pssm_LO,title=f'{k} (n={len(df_k):,})',figsize=(17,10))
path2=get_path('~/img/cddm/pssm_LO',f'{k}.svg')
save_show(path2,show_only=SHOW)
# plot S, T and Y motif
sty_cnt =df_k.acceptor.value_counts()
acceptors = sty_cnt[(sty_cnt/len(df_k) > 0.08) & (sty_cnt>=10)].index # Skip this site_type if it has less than 8% or less than 10 count
for site_type in acceptors:
df_sty = df_k[df_k.acceptor.str.upper()==site_type].copy()
# freq map
pssm_sty = get_prob(df_sty,'site_seq')
plot_logo_heatmap(pssm_sty,title=f'{k}: {site_type} sites (n={len(df_sty):,})',figsize=(17,10))
path_3=get_path('~/img/cddm/pssm_freq_acceptor',f'{k}_{site_type}.svg')
save_show(path_3,show_only=SHOW)
# for log-odds
pssm_LO = get_pssm_LO(pssm_sty,site_type)
plot_logo_heatmap_LO(pssm_LO,acceptor=site_type,title=f'{k}: {site_type} sites (n={len(df_sty):,})',figsize=(17,10))
path_4=get_path('~/img/cddm/pssm_LO_acceptor',f'{k}_{site_type}.svg')
save_show(path_4,show_only=SHOW)
path5=get_path('~/img/cddm/bar_acceptor',f'{k}.svg')
plot_cnt_acceptor(df_k)
save_show(path5,show_only=SHOW)
# count of source
path6=get_path('~/img/cddm/bar_source',f'{k}.svg')
plot_cnt_cddm(df_k)
save_show(path6,show_only=SHOW)
# histogram of num kin
path7=get_path('~/img/cddm/hist_num_kin',f'{k}.svg')
plot_hist_num_kin(df_k)
save_show(path7,show_only=SHOW)
# onehot of sequences
# filter out noise acceptor for stratification
df_k = df_k[df_k.acceptor.isin(acceptors)]
df_k,onehot_10 = get_onehot_add_cluster(df_k,n=10)
path8= get_path('~/img/cddm/pca_onehot',f'{k}.svg')
plot_onehot(onehot_10,df_k.Cluster)
save_show(path8,show_only=SHOW)
path9= get_path('~/img/cddm/motif_kmeans',f'{k}.svg')
get_kmeans_logos(df_k)
save_show(path9,show_only=SHOW)
path00= get_path('~/img/cddm/df_k',f'{k}.parquet')
df_k.to_parquet(path00)
plt.close()
# break100%|██████████| 10/10 [00:00<00:00, 179.35it/s]
100%|██████████| 10/10 [00:00<00:00, 519.73it/s]
100%|██████████| 10/10 [00:00<00:00, 177.82it/s]
100%|██████████| 10/10 [00:00<00:00, 179.58it/s]
100%|██████████| 10/10 [00:00<00:00, 169.36it/s]
100%|██████████| 10/10 [00:00<00:00, 517.55it/s]
100%|██████████| 10/10 [00:00<00:00, 198.53it/s]
100%|██████████| 10/10 [00:00<00:00, 236.72it/s]
100%|██████████| 10/10 [00:00<00:00, 178.37it/s]
100%|██████████| 10/10 [00:00<00:00, 132.38it/s]
100%|██████████| 10/10 [00:00<00:00, 510.61it/s]
100%|██████████| 10/10 [00:00<00:00, 127.77it/s]
100%|██████████| 10/10 [00:00<00:00, 455.63it/s]
100%|██████████| 10/10 [00:00<00:00, 357.39it/s]
100%|██████████| 10/10 [00:00<00:00, 347.38it/s]
100%|██████████| 10/10 [00:00<00:00, 109798.53it/s]
100%|██████████| 10/10 [00:00<00:00, 339.81it/s]
100%|██████████| 10/10 [00:00<00:00, 460.57it/s]
100%|██████████| 10/10 [00:00<00:00, 513.30it/s]
100%|██████████| 10/10 [00:00<00:00, 348.73it/s]
100%|██████████| 10/10 [00:00<00:00, 448.85it/s]
100%|██████████| 10/10 [00:00<00:00, 137518.16it/s]
100%|██████████| 10/10 [00:00<00:00, 87930.90it/s]
100%|██████████| 10/10 [00:00<00:00, 155922.08it/s]
100%|██████████| 10/10 [00:00<00:00, 174037.51it/s]
100%|██████████| 10/10 [00:00<00:00, 420.22it/s]
100%|██████████| 10/10 [00:00<00:00, 63937.56it/s]
100%|██████████| 10/10 [00:00<00:00, 162569.92it/s]
100%|██████████| 10/10 [00:00<00:00, 197.13it/s]
100%|██████████| 10/10 [00:00<00:00, 145635.56it/s]
100%|██████████| 10/10 [00:00<00:00, 112447.83it/s]
100%|██████████| 10/10 [00:00<00:00, 154202.35it/s]
100%|██████████| 10/10 [00:00<00:00, 149263.49it/s]
100%|██████████| 10/10 [00:00<00:00, 135737.99it/s]genes = set(df_k.substrate_genes.str.split(' ').str[0])path_ref = pd.read_excel('raw/idmapping_kinase_info_2025_05_27.xlsx')k'P00519_ABL1'path_ref['uniprot_gene'] = path_ref.uniprot+'_'+path_ref['Gene Names (primary)']idx_path = path_ref[path_ref.uniprot_gene==k].Reactome.str.split(';').iloc[0]path_df_raw| stId | dbId | name | llp | inDisease | species.dbId | species.taxId | species.name | entities.resource | entities.total | entities.found | entities.ratio | entities.pValue | entities.fdr | entities.exp | reactions.resource | reactions.total | reactions.found | reactions.ratio | |
|---|---|---|---|---|---|---|---|---|---|---|---|---|---|---|---|---|---|---|---|
| 0 | R-HSA-72649 | 72649 | Translation initiation complex formation | True | False | 48887 | 9606 | Homo sapiens | TOTAL | 62 | 39 | 0.003861 | 1.110223e-16 | 4.884981e-15 | [] | TOTAL | 2 | 2 | 0.000129 |
| 1 | R-HSA-72695 | 72695 | Formation of the ternary complex, and subseque... | True | False | 48887 | 9606 | Homo sapiens | TOTAL | 54 | 33 | 0.003362 | 1.110223e-16 | 4.884981e-15 | [] | TOTAL | 3 | 3 | 0.000193 |
| 2 | R-HSA-72702 | 72702 | Ribosomal scanning and start codon recognition | True | False | 48887 | 9606 | Homo sapiens | TOTAL | 64 | 39 | 0.003985 | 1.110223e-16 | 4.884981e-15 | [] | TOTAL | 2 | 2 | 0.000129 |
| 3 | R-HSA-72662 | 72662 | Activation of the mRNA upon binding of the cap... | True | False | 48887 | 9606 | Homo sapiens | TOTAL | 66 | 39 | 0.004110 | 1.110223e-16 | 4.884981e-15 | [] | TOTAL | 6 | 6 | 0.000386 |
| 4 | R-HSA-72706 | 72706 | GTP hydrolysis and joining of the 60S ribosoma... | True | False | 48887 | 9606 | Homo sapiens | TOTAL | 120 | 66 | 0.007472 | 1.110223e-16 | 4.884981e-15 | [] | TOTAL | 3 | 3 | 0.000193 |
| ... | ... | ... | ... | ... | ... | ... | ... | ... | ... | ... | ... | ... | ... | ... | ... | ... | ... | ... | ... |
| 1754 | R-HSA-198933 | 198933 | Immunoregulatory interactions between a Lympho... | True | False | 48887 | 9606 | Homo sapiens | TOTAL | 249 | 1 | 0.015504 | 1.000000e+00 | 1.000000e+00 | [] | TOTAL | 44 | 1 | 0.002829 |
| 1755 | R-HSA-373076 | 373076 | Class A/1 (Rhodopsin-like receptors) | True | False | 48887 | 9606 | Homo sapiens | TOTAL | 415 | 2 | 0.025841 | 1.000000e+00 | 1.000000e+00 | [] | TOTAL | 187 | 3 | 0.012023 |
| 1756 | R-HSA-425407 | 425407 | SLC-mediated transmembrane transport | False | False | 48887 | 9606 | Homo sapiens | TOTAL | 424 | 2 | 0.026401 | 1.000000e+00 | 1.000000e+00 | [] | TOTAL | 200 | 2 | 0.012858 |
| 1757 | R-HSA-500792 | 500792 | GPCR ligand binding | False | False | 48887 | 9606 | Homo sapiens | TOTAL | 610 | 4 | 0.037983 | 1.000000e+00 | 1.000000e+00 | [] | TOTAL | 219 | 4 | 0.014080 |
| 1758 | R-HSA-9709957 | 9709957 | Sensory Perception | False | False | 48887 | 9606 | Homo sapiens | TOTAL | 1258 | 10 | 0.078331 | 1.000000e+00 | 1.000000e+00 | [] | TOTAL | 138 | 2 | 0.008872 |
1759 rows × 19 columns
ref_paths = path_df_raw[path_df_raw.stId.isin(idx_path)]ref_paths.name80 RUNX1 regulates transcription of genes involve...
129 RHO GTPases Activate WASPs and WAVEs
157 Recruitment and ATM-mediated phosphorylation o...
306 MLL4 and MLL3 complexes regulate expression of...
423 Factors involved in megakaryocyte development ...
424 Cyclin D associated events in G1
473 Turbulent (oscillatory, disturbed) flow shear ...
485 Regulation of actin dynamics for phagocytic cu...
526 HDR through Single Strand Annealing (SSA)
629 FCGR3A-mediated phagocytosis
662 Role of ABL in ROBO-SLIT signaling
922 Myogenesis
1193 RUNX2 regulates osteoblast differentiation
Name: name, dtype: objectidx_path['R-HSA-2029482',
'R-HSA-428890',
'R-HSA-525793',
'R-HSA-5663213',
'R-HSA-5685938',
'R-HSA-5693565',
'R-HSA-69231',
'R-HSA-8939236',
'R-HSA-8940973',
'R-HSA-9664422',
'R-HSA-983231',
'R-HSA-9841922',
'R-HSA-9860927',
'']path_df = get_reactome(genes)path_df| name | fdr | -log10_fdr | |
|---|---|---|---|
| 0 | Translation initiation complex formation | 4.884981e-15 | 14.311 |
| 1 | Formation of the ternary complex, and subseque... | 4.884981e-15 | 14.311 |
| 2 | Ribosomal scanning and start codon recognition | 4.884981e-15 | 14.311 |
| 3 | Activation of the mRNA upon binding of the cap... | 4.884981e-15 | 14.311 |
| 4 | GTP hydrolysis and joining of the 60S ribosoma... | 4.884981e-15 | 14.311 |
| ... | ... | ... | ... |
| 1754 | Immunoregulatory interactions between a Lympho... | 1.000000e+00 | 0.000 |
| 1755 | Class A/1 (Rhodopsin-like receptors) | 1.000000e+00 | 0.000 |
| 1756 | SLC-mediated transmembrane transport | 1.000000e+00 | 0.000 |
| 1757 | GPCR ligand binding | 1.000000e+00 | 0.000 |
| 1758 | Sensory Perception | 1.000000e+00 | -0.000 |
1759 rows × 3 columns
ref_paths.name.shape(13,)plot_path(path_df,top_n=50,path_list=ref_paths.name)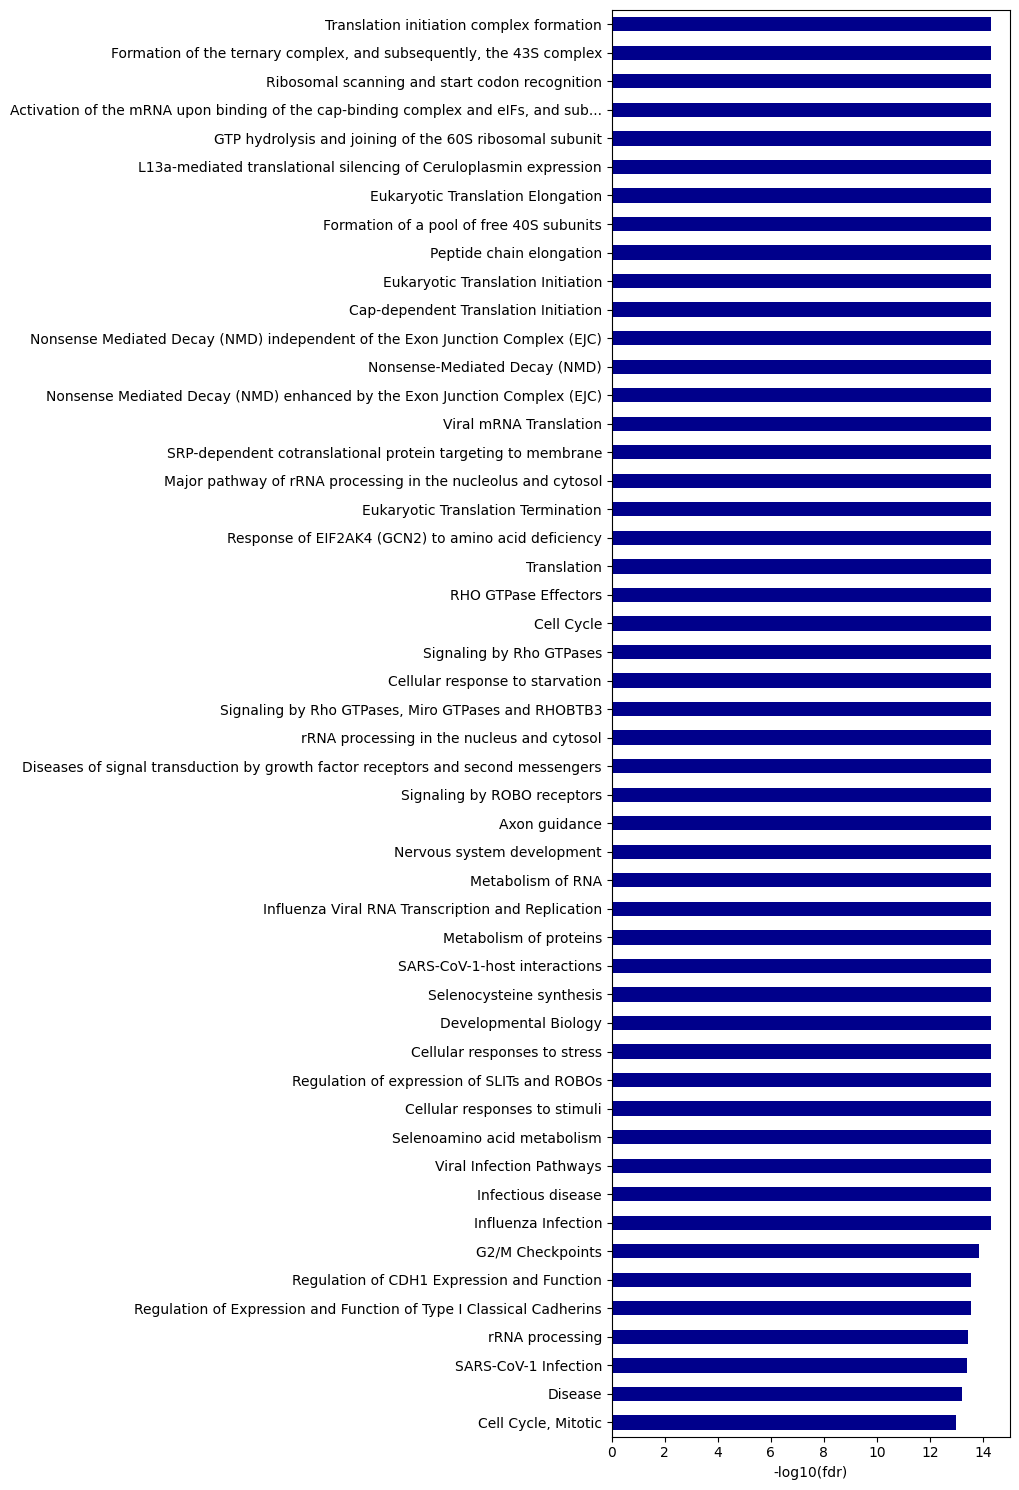
path_df_raw[path_df_raw.stId.isin(idx_path)]def get_reactome(gene_list,
col='entities.fdr', # column of p value or fdr (e.g., entities.pValue)
ref_list=None, # list of reactome idx
):
"Reactome pathway analysis for a given gene set; returns formated output in dataframe with additional -log10(p)"
out = get_reactome_raw(gene_list).copy()
col_rename = col.split('.')[1]
out = out[['stId','name',col]].rename(columns={col:col_rename,'stId':'ID'})
out['significant']=(out[col_rename]<=0.05).astype(int)
out[f'-log10({col_rename})'] = -np.log10(out[col_rename]).round(3)
out[f'rank']=out[col_rename].rank().astype(int)
if ref_list: out['in_ref']=out.ID.isin(ref_list).astype(int)
return outout = get_reactome(genes,ref_list=idx_path)out[out.in_ref==1]| ID | name | fdr | significant | -log10(fdr) | rank | in_ref | |
|---|---|---|---|---|---|---|---|
| 80 | R-HSA-8939236 | RUNX1 regulates transcription of genes involve... | 1.253766e-08 | 1 | 7.902 | 81 | 1 |
| 129 | R-HSA-5663213 | RHO GTPases Activate WASPs and WAVEs | 3.404711e-06 | 1 | 5.468 | 130 | 1 |
| 157 | R-HSA-5693565 | Recruitment and ATM-mediated phosphorylation o... | 1.482829e-05 | 1 | 4.829 | 156 | 1 |
| 306 | R-HSA-9841922 | MLL4 and MLL3 complexes regulate expression of... | 6.713774e-04 | 1 | 3.173 | 304 | 1 |
| 423 | R-HSA-983231 | Factors involved in megakaryocyte development ... | 4.163072e-03 | 1 | 2.381 | 424 | 1 |
| 424 | R-HSA-69231 | Cyclin D associated events in G1 | 4.191536e-03 | 1 | 2.378 | 426 | 1 |
| 473 | R-HSA-9860927 | Turbulent (oscillatory, disturbed) flow shear ... | 7.981719e-03 | 1 | 2.098 | 474 | 1 |
| 485 | R-HSA-2029482 | Regulation of actin dynamics for phagocytic cu... | 9.889877e-03 | 1 | 2.005 | 486 | 1 |
| 526 | R-HSA-5685938 | HDR through Single Strand Annealing (SSA) | 1.734879e-02 | 1 | 1.761 | 527 | 1 |
| 629 | R-HSA-9664422 | FCGR3A-mediated phagocytosis | 4.756334e-02 | 1 | 1.323 | 630 | 1 |
| 662 | R-HSA-428890 | Role of ABL in ROBO-SLIT signaling | 6.281753e-02 | 0 | 1.202 | 663 | 1 |
| 922 | R-HSA-525793 | Myogenesis | 1.742057e-01 | 0 | 0.759 | 923 | 1 |
| 1193 | R-HSA-8940973 | RUNX2 regulates osteoblast differentiation | 4.049378e-01 | 0 | 0.393 | 1194 | 1 |
out.fdr.rank()0 22.0
1 22.0
2 22.0
3 22.0
4 22.0
...
1754 1755.0
1755 1756.0
1756 1757.0
1757 1758.0
1758 1759.0
Name: fdr, Length: 1759, dtype: float64def plot_path(df,col='-log10(fdr)', top_n=10,max_label_length=80):
"Plot the bar graph of pathways from get_reactome function."
# Extract the data and reverse it
data = df.head(top_n).set_index('name')[col].iloc[::-1]
# Truncate labels if they are too long
truncated_labels = [label[:max_label_length] + '...' if len(label) > max_label_length else label for label in data.index]
data.index = truncated_labels
# Calculate the required width: base width + additional width for the longest label
base_width = 2
max_label_length = max(data.index, key=len)
additional_width = len(max_label_length) * 0.1 # Adjust scaling factor as needed
figsize = (base_width + additional_width, 3*top_n/10) # Adjust height as necessary
data.plot.barh(figsize=figsize)
plt.ylabel('')
plt.xlabel(col)
plt.tight_layout()import matplotlib.pyplot as plt
def plot_path(df, col='-log10(fdr)', top_n=10, max_label_length=80, path_list=None):
"""
Plot the bar graph of pathways from get_reactome function.
Highlights pathways in path_list with a different color (dark red).
"""
# Extract and reverse data
data = df.head(top_n).set_index('name')[col].iloc[::-1]
# Save original full names to match against path_list
full_names = data.index.tolist()
# Truncate labels if too long
truncated_labels = [label[:max_label_length] + '...' if len(label) > max_label_length else label for label in full_names]
data.index = truncated_labels
# Determine colors
if path_list is not None:
path_set = set(path_list)
colors = ['darkred' if name in path_set else 'darkblue' for name in full_names]
else:
colors = 'darkblue'
# Calculate dynamic figure width
base_width = 2
max_label = max(data.index, key=len)
additional_width = len(max_label) * 0.1
figsize = (base_width + additional_width, 3 * top_n / 10)
# Plot
ax = data.plot.barh(figsize=figsize, color=colors)
plt.ylabel('')
plt.xlabel(col)
plt.tight_layout()
return axpath_fdr = path_df_raw[path_df_raw['entities.fdr']<0.05]path_fdr| stId | dbId | name | llp | inDisease | species.dbId | species.taxId | species.name | entities.resource | entities.total | entities.found | entities.ratio | entities.pValue | entities.fdr | entities.exp | reactions.resource | reactions.total | reactions.found | reactions.ratio | |
|---|---|---|---|---|---|---|---|---|---|---|---|---|---|---|---|---|---|---|---|
| 0 | R-HSA-72649 | 72649 | Translation initiation complex formation | True | False | 48887 | 9606 | Homo sapiens | TOTAL | 62 | 39 | 0.003861 | 1.110223e-16 | 4.884981e-15 | [] | TOTAL | 2 | 2 | 0.000129 |
| 1 | R-HSA-72695 | 72695 | Formation of the ternary complex, and subseque... | True | False | 48887 | 9606 | Homo sapiens | TOTAL | 54 | 33 | 0.003362 | 1.110223e-16 | 4.884981e-15 | [] | TOTAL | 3 | 3 | 0.000193 |
| 2 | R-HSA-72702 | 72702 | Ribosomal scanning and start codon recognition | True | False | 48887 | 9606 | Homo sapiens | TOTAL | 64 | 39 | 0.003985 | 1.110223e-16 | 4.884981e-15 | [] | TOTAL | 2 | 2 | 0.000129 |
| 3 | R-HSA-72662 | 72662 | Activation of the mRNA upon binding of the cap... | True | False | 48887 | 9606 | Homo sapiens | TOTAL | 66 | 39 | 0.004110 | 1.110223e-16 | 4.884981e-15 | [] | TOTAL | 6 | 6 | 0.000386 |
| 4 | R-HSA-72706 | 72706 | GTP hydrolysis and joining of the 60S ribosoma... | True | False | 48887 | 9606 | Homo sapiens | TOTAL | 120 | 66 | 0.007472 | 1.110223e-16 | 4.884981e-15 | [] | TOTAL | 3 | 3 | 0.000193 |
| ... | ... | ... | ... | ... | ... | ... | ... | ... | ... | ... | ... | ... | ... | ... | ... | ... | ... | ... | ... |
| 631 | R-HSA-8866427 | 8866427 | VLDLR internalisation and degradation | True | False | 48887 | 9606 | Homo sapiens | TOTAL | 16 | 4 | 0.000996 | 2.450345e-02 | 4.900690e-02 | [] | TOTAL | 4 | 4 | 0.000257 |
| 632 | R-HSA-8984722 | 8984722 | Interleukin-35 Signalling | True | False | 48887 | 9606 | Homo sapiens | TOTAL | 16 | 4 | 0.000996 | 2.450345e-02 | 4.900690e-02 | [] | TOTAL | 26 | 25 | 0.001672 |
| 633 | R-HSA-1679131 | 1679131 | Trafficking and processing of endosomal TLR | True | False | 48887 | 9606 | Homo sapiens | TOTAL | 16 | 4 | 0.000996 | 2.450345e-02 | 4.900690e-02 | [] | TOTAL | 7 | 4 | 0.000450 |
| 634 | R-HSA-879415 | 879415 | Advanced glycosylation endproduct receptor sig... | True | False | 48887 | 9606 | Homo sapiens | TOTAL | 16 | 4 | 0.000996 | 2.450345e-02 | 4.900690e-02 | [] | TOTAL | 4 | 2 | 0.000257 |
| 635 | R-HSA-2173789 | 2173789 | TGF-beta receptor signaling activates SMADs | True | False | 48887 | 9606 | Homo sapiens | TOTAL | 51 | 8 | 0.003176 | 2.483726e-02 | 4.967452e-02 | [] | TOTAL | 44 | 26 | 0.002829 |
636 rows × 19 columns
plot_path??Signature: plot_path(react_out, top_n=10, max_label_length=80) Source: def plot_path(react_out, top_n=10,max_label_length=80): "Plot the bar graph of pathways from get_reactome function." # Extract the data and reverse it data = react_out.head(top_n).set_index('name')['-log10_pValue'].iloc[::-1] # Truncate labels if they are too long truncated_labels = [label[:max_label_length] + '...' if len(label) > max_label_length else label for label in data.index] data.index = truncated_labels # Calculate the required width: base width + additional width for the longest label base_width = 2 max_label_length = max(data.index, key=len) additional_width = len(max_label_length) * 0.1 # Adjust scaling factor as needed figsize = (base_width + additional_width, 3*top_n/10) # Adjust height as necessary data.plot.barh(figsize=figsize) plt.ylabel('') plt.xlabel('-log10(p)') plt.tight_layout() File: ~/katlas/katlas/utils.py Type: function
path_fdr.loc[path_fdr['entities.ratio'].sort_values(ascending=False).index]| stId | dbId | name | llp | inDisease | species.dbId | species.taxId | species.name | entities.resource | entities.total | entities.found | entities.ratio | entities.pValue | entities.fdr | entities.exp | reactions.resource | reactions.total | reactions.found | reactions.ratio | |
|---|---|---|---|---|---|---|---|---|---|---|---|---|---|---|---|---|---|---|---|
| 180 | R-HSA-162582 | 162582 | Signal Transduction | False | False | 48887 | 9606 | Homo sapiens | TOTAL | 3049 | 267 | 0.189851 | 3.562203e-06 | 3.562203e-05 | [] | TOTAL | 2584 | 1258 | 0.166131 |
| 48 | R-HSA-1643685 | 1643685 | Disease | False | True | 48887 | 9606 | Homo sapiens | TOTAL | 2851 | 299 | 0.177522 | 1.554312e-15 | 6.061818e-14 | [] | TOTAL | 2011 | 716 | 0.129292 |
| 94 | R-HSA-168256 | 168256 | Immune System | False | False | 48887 | 9606 | Homo sapiens | TOTAL | 2664 | 256 | 0.165878 | 2.664359e-09 | 5.328718e-08 | [] | TOTAL | 1733 | 791 | 0.111418 |
| 32 | R-HSA-392499 | 392499 | Metabolism of proteins | False | False | 48887 | 9606 | Homo sapiens | TOTAL | 2417 | 268 | 0.150498 | 1.110223e-16 | 4.884981e-15 | [] | TOTAL | 909 | 428 | 0.058442 |
| 188 | R-HSA-74160 | 74160 | Gene expression (Transcription) | False | False | 48887 | 9606 | Homo sapiens | TOTAL | 1990 | 186 | 0.123910 | 4.133596e-06 | 3.895872e-05 | [] | TOTAL | 1140 | 486 | 0.073293 |
| ... | ... | ... | ... | ... | ... | ... | ... | ... | ... | ... | ... | ... | ... | ... | ... | ... | ... | ... | ... |
| 443 | R-HSA-9818025 | 9818025 | NFE2L2 regulating TCA cycle genes | True | False | 48887 | 9606 | Homo sapiens | TOTAL | 7 | 4 | 0.000436 | 1.440323e-03 | 5.761294e-03 | [] | TOTAL | 4 | 4 | 0.000257 |
| 474 | R-HSA-9649913 | 9649913 | RAS GTPase cycle mutants | False | True | 48887 | 9606 | Homo sapiens | TOTAL | 4 | 3 | 0.000249 | 2.704293e-03 | 8.112878e-03 | [] | TOTAL | 2 | 2 | 0.000129 |
| 475 | R-HSA-9753510 | 9753510 | Signaling by RAS GAP mutants | True | True | 48887 | 9606 | Homo sapiens | TOTAL | 4 | 3 | 0.000249 | 2.704293e-03 | 8.112878e-03 | [] | TOTAL | 1 | 1 | 0.000064 |
| 476 | R-HSA-9753512 | 9753512 | Signaling by RAS GTPase mutants | True | True | 48887 | 9606 | Homo sapiens | TOTAL | 4 | 3 | 0.000249 | 2.704293e-03 | 8.112878e-03 | [] | TOTAL | 1 | 1 | 0.000064 |
| 610 | R-HSA-9636667 | 9636667 | Manipulation of host energy metabolism | True | True | 48887 | 9606 | Homo sapiens | TOTAL | 3 | 2 | 0.000187 | 1.804436e-02 | 4.155485e-02 | [] | TOTAL | 2 | 2 | 0.000129 |
636 rows × 19 columns
path_df = get_reactome(genes)plot_path??Signature: plot_path(react_out, top_n=10, max_label_length=80) Source: def plot_path(react_out, top_n=10,max_label_length=80): "Plot the bar graph of pathways from get_reactome function." # Extract the data and reverse it data = react_out.head(top_n).set_index('name')['-log10_pValue'].iloc[::-1] # Truncate labels if they are too long truncated_labels = [label[:max_label_length] + '...' if len(label) > max_label_length else label for label in data.index] data.index = truncated_labels # Calculate the required width: base width + additional width for the longest label base_width = 2 max_label_length = max(data.index, key=len) additional_width = len(max_label_length) * 0.1 # Adjust scaling factor as needed figsize = (base_width + additional_width, 3*top_n/10) # Adjust height as necessary data.plot.barh(figsize=figsize) plt.ylabel('') plt.xlabel('-log10(p)') plt.tight_layout() File: ~/katlas/katlas/utils.py Type: function
path_df| name | pValue | -log10_pValue | |
|---|---|---|---|
| 0 | Translation initiation complex formation | 1.110223e-16 | 15.955 |
| 1 | Formation of the ternary complex, and subseque... | 1.110223e-16 | 15.955 |
| 2 | Ribosomal scanning and start codon recognition | 1.110223e-16 | 15.955 |
| 3 | Activation of the mRNA upon binding of the cap... | 1.110223e-16 | 15.955 |
| 4 | GTP hydrolysis and joining of the 60S ribosoma... | 1.110223e-16 | 15.955 |
| ... | ... | ... | ... |
| 1754 | Immunoregulatory interactions between a Lympho... | 1.000000e+00 | 0.000 |
| 1755 | Class A/1 (Rhodopsin-like receptors) | 1.000000e+00 | 0.000 |
| 1756 | SLC-mediated transmembrane transport | 1.000000e+00 | 0.000 |
| 1757 | GPCR ligand binding | 1.000000e+00 | 0.000 |
| 1758 | Sensory Perception | 1.000000e+00 | -0.000 |
1759 rows × 3 columns
plot_path(path_df,100)
plt.title('AKT1')
Text(0.5, 1.0, 'AKT1')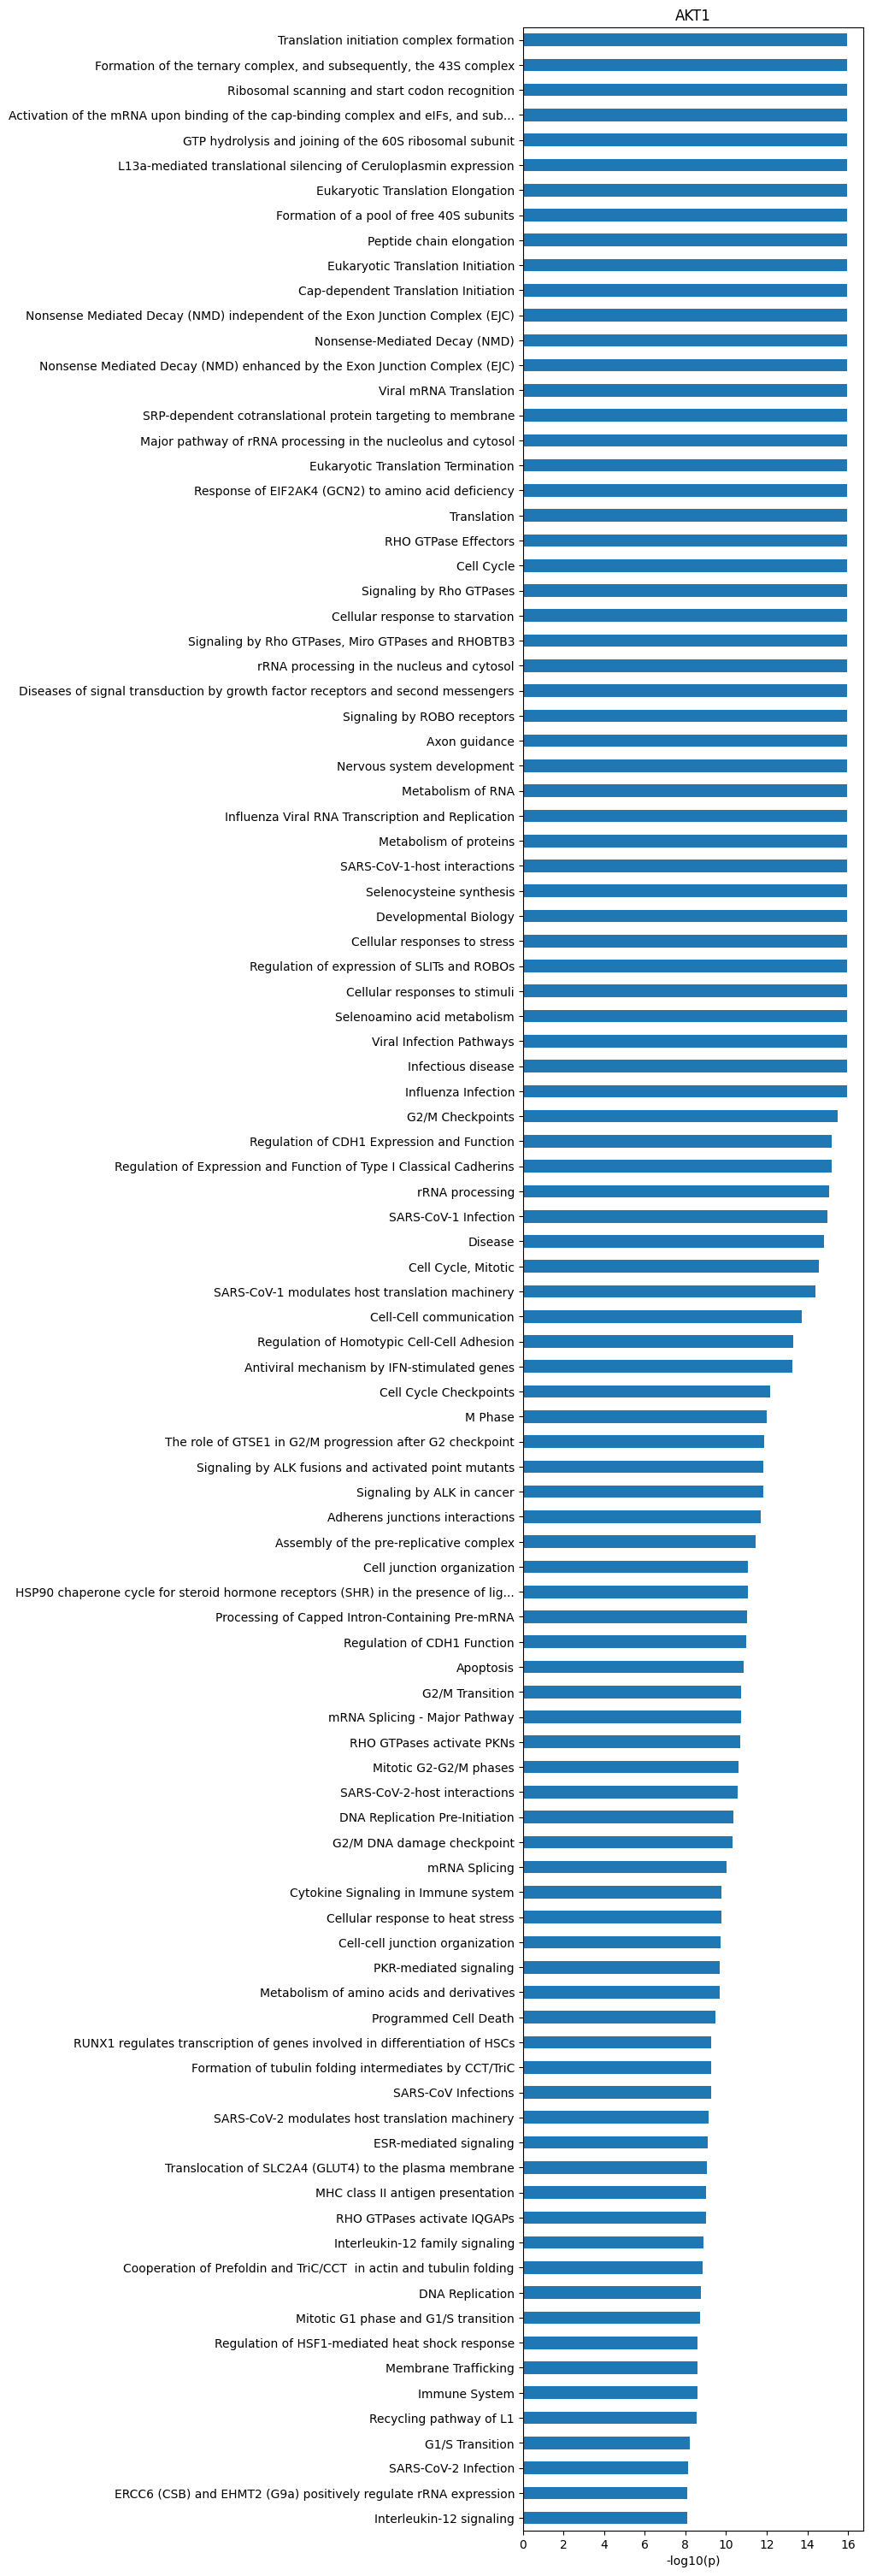
genesimport matplotlib.pyplot as plt
import seaborn as sns
from katlas.core import *
from katlas.plot import *
from scipy.stats import spearmanr, pearsonr
import os
from PIL import Image
from tqdm import tqdmdef plot_count(df_k,title):
# Get value counts
source_counts = df_k.source.replace({'pplus':'PP','large_scale':'LS'}).value_counts()
plt.figure(figsize=(7,1))
source_counts.plot(kind='barh', stacked=True, color=['darkred', 'darkblue'])
# Annotate with the actual values
for index, value in enumerate(source_counts):
plt.text(value, index, str(value),fontsize=10,rotation=-90, va='center')
plt.xlabel('Count')
plt.title(title)sns.set(rc={"figure.dpi":200, 'savefig.dpi':200})
sns.set_context('notebook')
sns.set_style("ticks")Load data
df = Data.get_ks_dataset()
df['SUB'] = df.substrate.str.upper()info = Data.get_kinase_info().query('pseudo=="0"')# It only contains kinase on the tree
cnt = df.kinase_paper.value_counts()ST = info[info.group!="TK"].kinasedf[df.kinase_paper.isin(ST)].kinase_paper.value_counts()[10:20]NEK6 950
PLK1 943
CK2A1 919
P38D 907
DYRK2 907
HGK 902
TTBK1 896
MST3 890
MST1 884
IKKE 880
Name: kinase_paper, dtype: int64cnt = cnt[cnt>100]Generate example figures
def plot_heatmap2(matrix, title, figsize=(6,10), label_size=20):
plt.figure(figsize=figsize)
sns.heatmap(matrix, cmap='binary', annot=False,cbar=False)
plt.title(title,fontsize=label_size)
# Set the font size for the tick labels
plt.xticks(fontsize=label_size)
plt.yticks(fontsize=label_size)
plt.xlabel('')
plt.ylabel('')kinase_list = ['SRC','ABL1','ERK2','PKACA']sns.set(rc={"figure.dpi":200, 'savefig.dpi':200})
sns.set_context('notebook')
sns.set_style("ticks")
for k in kinase_list:
df_k = df.query(f'kinase=="{k}"')
df_k = df_k.drop_duplicates(subset='SUB').reset_index()
paper,full = get_freq(df_k)
plot_heatmap2(full.drop(columns=[0]),f'{k}',figsize=(6,10))
plt.show()
plt.close()
break
# if you want to generate and save all of figures, uncomment below
# plt.savefig(f'fig/{k}.png',bbox_inches='tight', pad_inches=0.3)
# plt.close()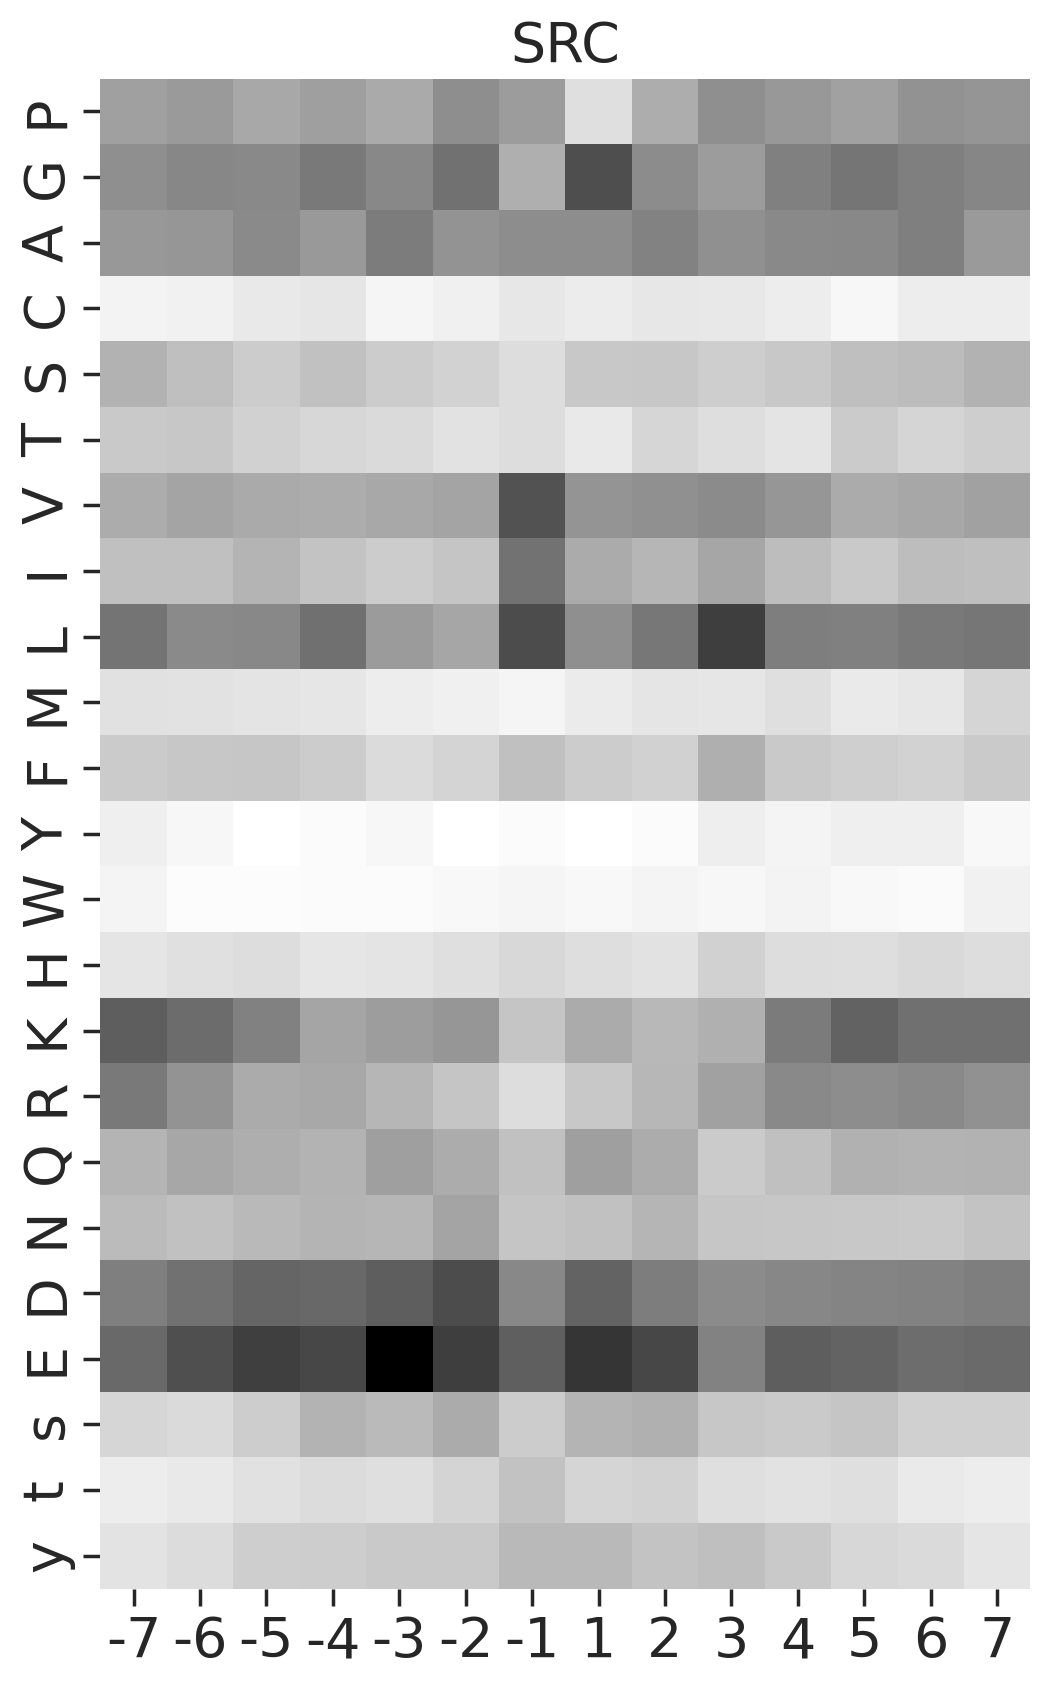
Generate all figures
Uncomment plt.savefig to save figures
sns.set(rc={"figure.dpi":200, 'savefig.dpi':200})
sns.set_context('notebook')
sns.set_style("ticks")
for k in tqdm(cnt.index,total=len(cnt)):
df_k = df.query(f'kinase=="{k}"')
plot_count(df_k,k)
# plt.savefig(f'fig/count/{k}.png',bbox_inches='tight', pad_inches=0.1)
plt.show() # if visualize in jupyter notebook, uncheck the savefig
plt.close()
df_k = df_k.drop_duplicates(subset='SUB').reset_index()
paper,full = get_freq(df_k)
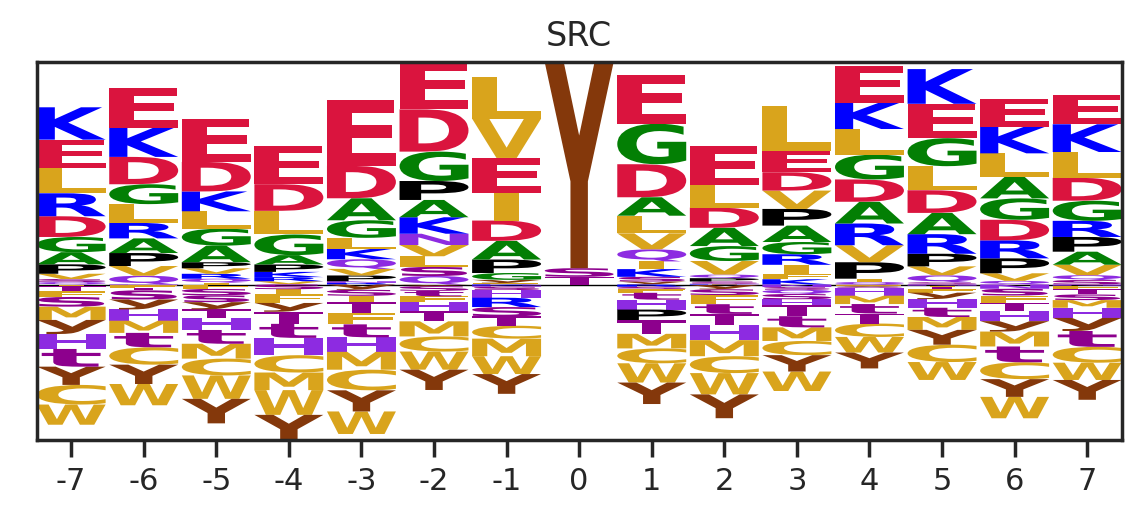
get_logo2(full, k)
# plt.savefig(f'fig/logo/{k}.png',bbox_inches='tight', pad_inches=0.3)
plt.show()
plt.close()
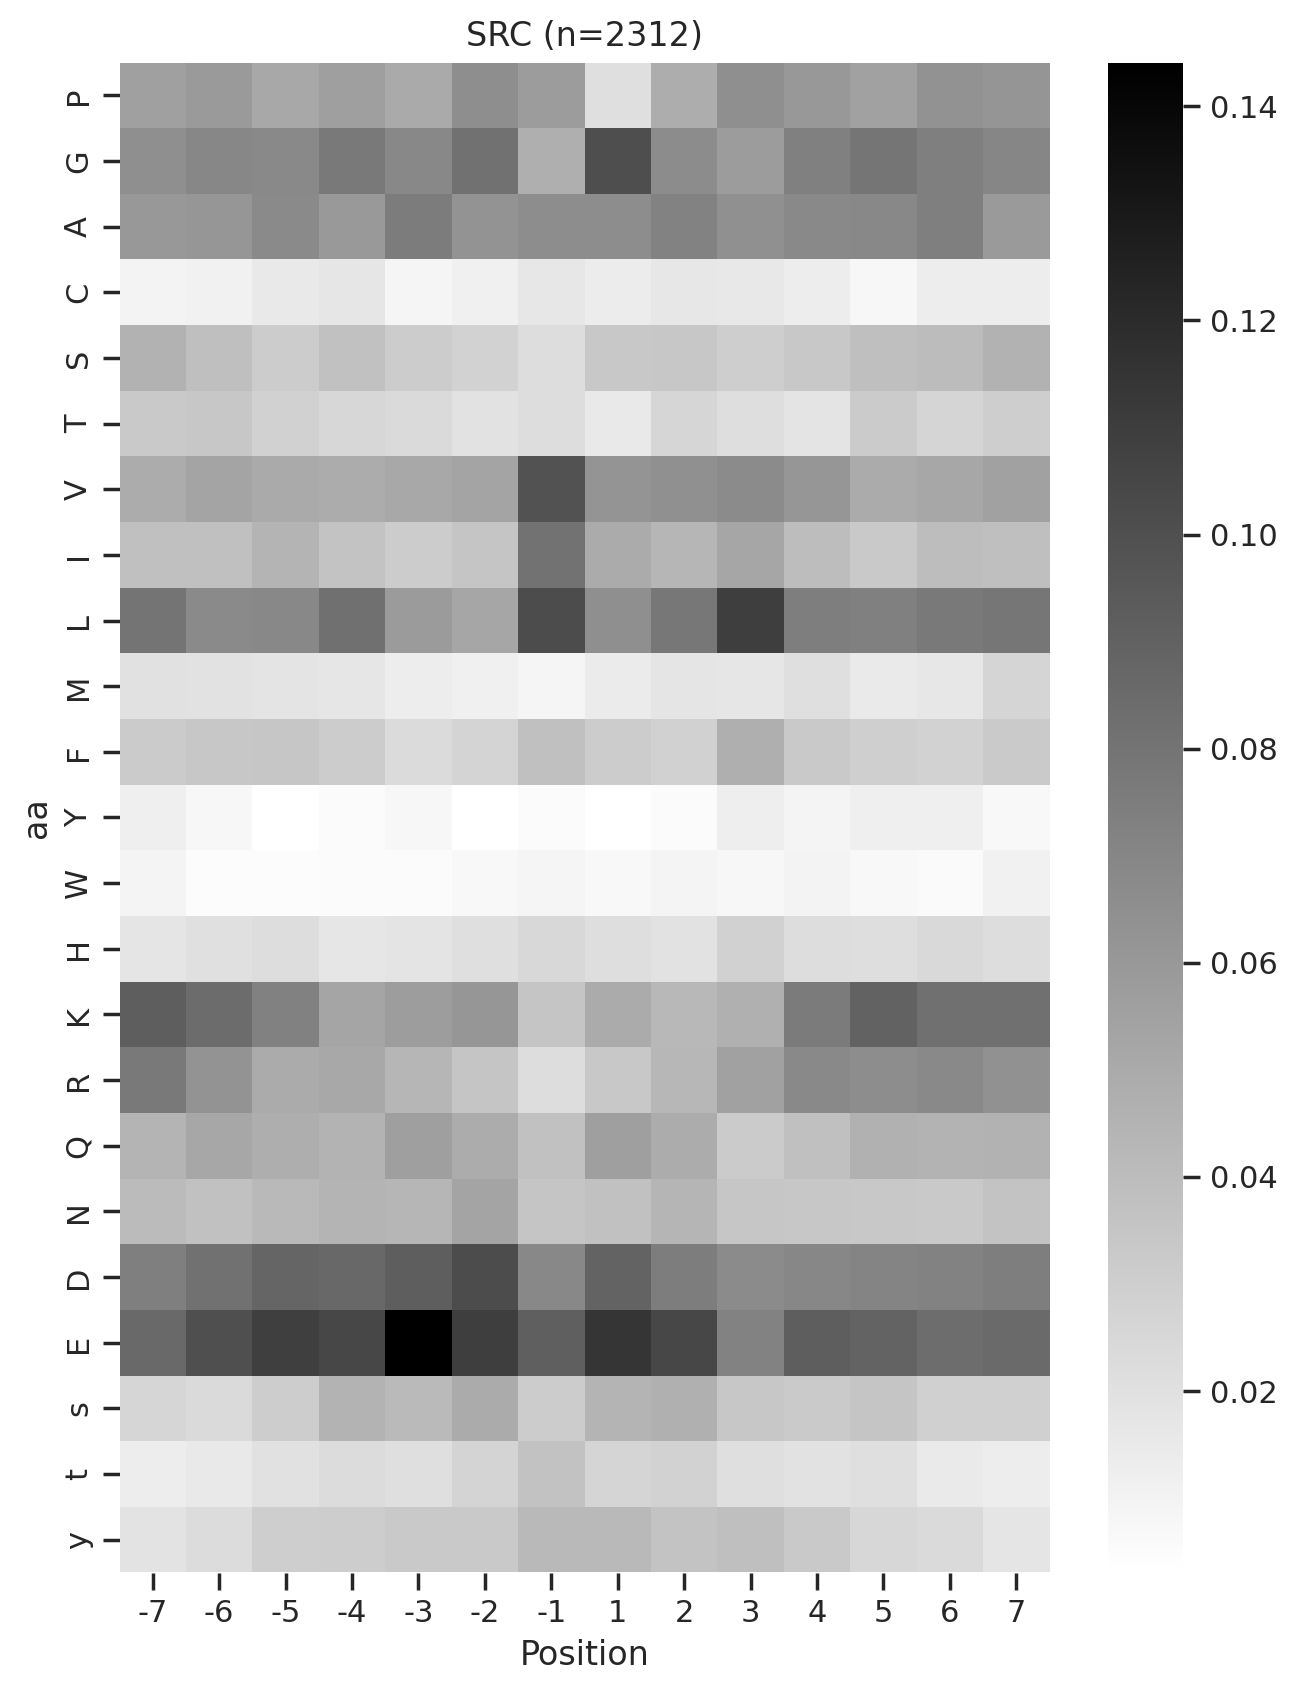
plot_heatmap(full.drop(columns=[0]),f'{k} (n={len(df_k)})',figsize=(7.5,10))
# plt.savefig(f'fig/heatmap/{k}.png',bbox_inches='tight', pad_inches=0)
plt.show()
plt.close()
# break
break 0%| | 0/289 [00:00<?, ?it/s]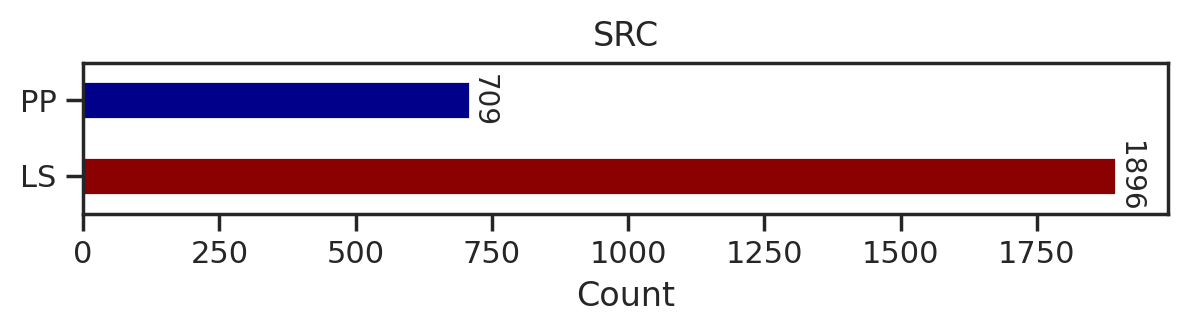
0%| | 0/289 [00:02<?, ?it/s]Combine figures for pdf
def combine_images_vertically(image_paths, output_path):
    images = [Image.open(image_path).convert('RGBA') for image_path in image_paths]

    total_width = max(image.width for image in images)
    total_height = sum(image.height for image in images)

    combined_image = Image.new('RGBA', (total_width, total_height))

    y_offset = 0
    for image in images:
        combined_image.paste(image, (0, y_offset), image)
        y_offset += image.height

    combined_image.save(output_path)
Uncomment below to run
# folders = ["fig/count", "fig/logo", "fig/heatmap"]
# for k in tqdm(cnt.index,total=len(cnt)):
#     filename = f"{k}.png"
#     image_paths = [os.path.join(folder, filename) for folder in folders]
#     output_path = f"fig/combine/{k}.png"

#     combine_images_vertically(image_paths, output_path)
#     # break
Get PSSM data of CDDM
for i,k in enumerate(cnt.index):

    df_k = df.query(f'kinase=="{k}"')
    df_k = df_k.drop_duplicates(subset='SUB').reset_index()

    paper,full = get_freq(df_k)

    melt = full.drop(columns = [0]).reset_index().melt(id_vars=['aa'], value_name=k, var_name='Position')
    melt['substrate']=melt['Position'].astype(str)+ melt['aa']

    position_0 = full[0][['s','t','y']].reset_index().rename(columns={0:k})
    position_0['substrate'] = '0'+position_0['aa']

    if i ==0:
        first = pd.concat([melt,position_0])[['substrate',k]].set_index('substrate')
    else:
        k = pd.concat([melt,position_0])[['substrate',k]].set_index('substrate')
        data = pd.concat([first,k],axis=1)
        first = data.copy()

    # break
data = data.T
data.index = data.index.rename('kinase')To save
# data.to_csv('supp/CDDM.csv')

# data.to_parquet('ks_main.parquet')
Get specialized CDDM data for all-capital substrates
combine s,t,y to S,T,Y
# List of suffixes
suffixes = ['S', 'T', 'Y']

for suffix in suffixes:
    for i in range(-7, 8):  # looping from -7 to 7
        if i == 0:  # Skip 0
            continue

        upper_col = f"{i}{suffix}"  # e.g., -7S
        lower_col = f"{i}{suffix.lower()}"  # e.g., -7s
        data[upper_col] = data[upper_col] + data[lower_col]
data.drop(lower_col, axis=1,inplace=True) # Drop the lowercase column after combiningdata.columns[data.columns.str.contains('S')]Index(['-7S', '-6S', '-5S', '-4S', '-3S', '-2S', '-1S', '1S', '2S', '3S', '4S',
'5S', '6S', '7S'],
dtype='object', name='substrate')# make sure the "s" in positions other than 0 is deleted from the columns
data.columns[data.columns.str.contains('s')]Index(['0s'], dtype='object', name='substrate')# Make sure very position's sum is 1
data.loc[:,data.columns.str.contains('-7')].sum(1).sort_values()kinase
DDR2 1.0
NEK11 1.0
MSK1 1.0
TEK 1.0
NIM1 1.0
...
CAMK2G 1.0
PKG2 1.0
MELK 1.0
NEK1 1.0
TLK2 1.0
Length: 289, dtype: float64data = data.rename(columns={'0s':'0S','0t':'0T','0y':'0Y'})data.index = data.index.rename('kinase')To save
# data.to_parquet('ks_main_upper.parquet')
# data.to_csv('supp/CDDM_upper.csv')
Plot other kinases (mutated, lipid kinase, isoforms)
kinases not on kinome tree
cnt_other = df.query('on_tree==0').kinase.value_counts()

cnt_other = cnt_other[cnt_other>100]
others = cnt_other.index.tolist()+['LYN','ABL1','RET','FGFR3','PDGFRA','ALK',
'EGFR','KIT','MET','PKCB','BRAF','PKG1'] # BRAF is less than 100Uncheck savefig to save figures
for k in tqdm(others,total=len(others)):
df_k = df.query(f'kinase=="{k}"')
plot_count(df_k,k)
# plt.savefig(f'fig_others/count/{k.replace("/", "_")}.png',bbox_inches='tight', pad_inches=0.1)
plt.show() # if visualize in jupyter notebook, uncheck the savefig
plt.close()
df_k = df_k.drop_duplicates(subset='SUB').reset_index()
paper,full = get_freq(df_k)
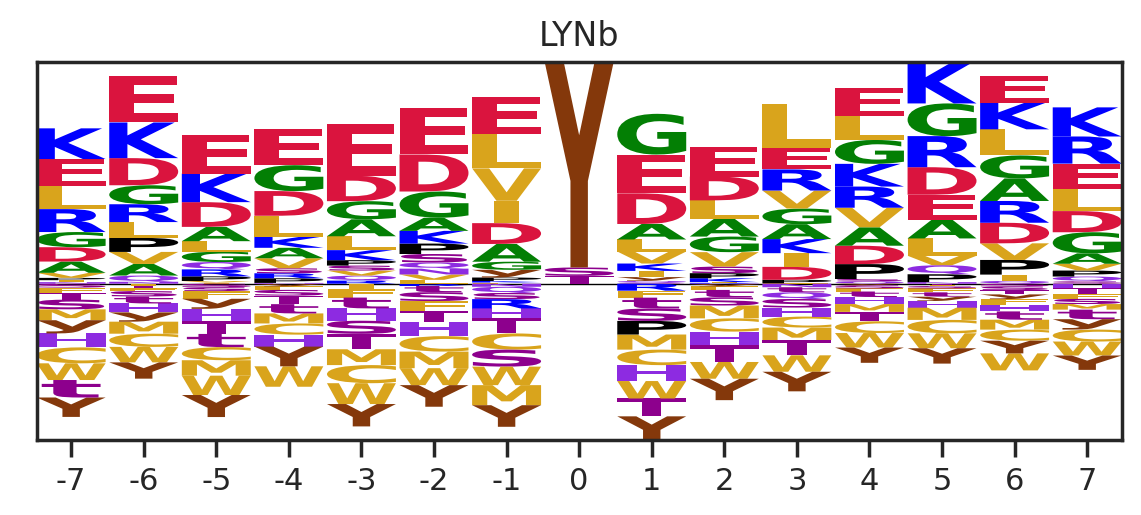
get_logo2(full,k)
# plt.savefig(f'fig_others/logo/{k.replace("/", "_")}.png',bbox_inches='tight', pad_inches=0.3)
plt.show()
plt.close()
plot_heatmap(full.drop(columns=[0]),f'{k} (n={len(df_k)})',figsize=(7.5,10))
# plt.savefig(f'fig_others/heatmap/{k.replace("/", "_")}.png',bbox_inches='tight', pad_inches=0)
plt.show()
plt.close()
break 0%| | 0/36 [00:00<?, ?it/s]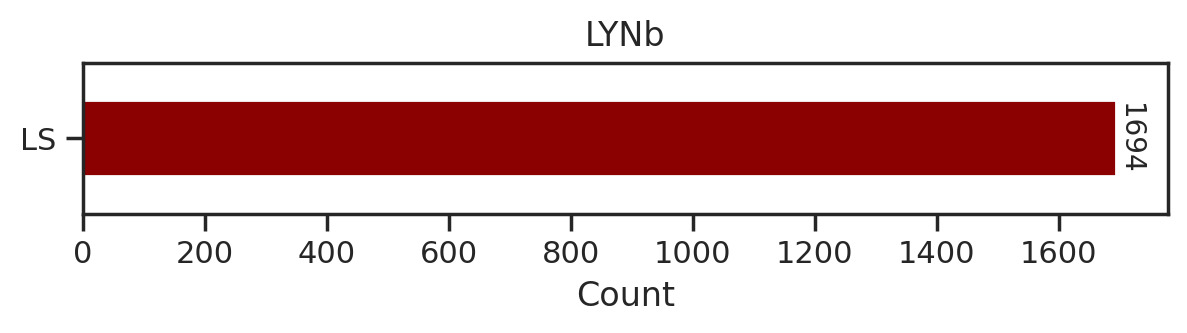
0%| | 0/36 [00:01<?, ?it/s]Combine the figures for pdf
Uncomment below to run
# folders = ["fig_others/count", "fig_others/logo", "fig_others/heatmap"]
# for k in tqdm(others,total = len(others)):
#     k = k.replace("/", "_")

#     filename = f"{k}.png"

#     image_paths = [os.path.join(folder, filename) for folder in folders]

#     output_path = f"fig_others/combine/{k}.png"

#     combine_images_vertically(image_paths, output_path)
#     # break
Get the PSSMs of other kinases
for i,k in enumerate(others):
    df_k = df.query(f'kinase=="{k}"')
    df_k = df_k.drop_duplicates(subset='SUB').reset_index()

    paper,full = get_freq(df_k)

    melt = full.drop(columns = [0]).reset_index().melt(id_vars=['aa'], value_name=k, var_name='Position')
    melt['substrate']=melt['Position'].astype(str)+ melt['aa']

    position_0 = full[0][['s','t','y']].reset_index().rename(columns={0:k})
    position_0['substrate'] = '0'+position_0['aa']

    if i ==0:
        first = pd.concat([melt,position_0])[['substrate',k]].set_index('substrate')
    else:
        k = pd.concat([melt,position_0])[['substrate',k]].set_index('substrate')
        data = pd.concat([first,k],axis=1)
        first = data.copy()
data = data.T
data.index = data.index.rename('kinase')To save:
# data.to_csv('supp/CDDM_others.csv')

# data.to_parquet('ks_others.parquet')