This module provides tools for visualizing Position-Specific Scoring Matrices (PSSMs) from Positional Scanning Peptide Array (PSPA) kinase substrate specificity data.
Data Preprocessing
preprocess_pspa(pssm) — Prepares raw PSSM data for logo visualization. It removes the duplicate ‘s’ row (since it duplicates ‘t’), renames phospho-residues to ‘pS/pT’ and ‘pY’, and applies log₂ transformation relative to the median (excluding position 0, which is handled separately via scaling).
pssm = preprocess_pspa( pssm=raw_pssm, # DataFrame with amino acids as index, positions as columns)
Visualization Functions
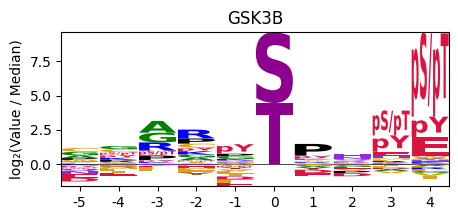
plot_logo_pspa(row, title, figsize) — Generates a sequence logo from a single row of PSPA data. The letter heights represent log₂(value/median), showing amino acid preferences at each position.
plot_logo_pspa( row=pspa.loc['GSK3B'], # single kinase row from Data.get_pspa() title='GSK3B', # plot title figsize=(5, 2), # figure dimensions (width, height))
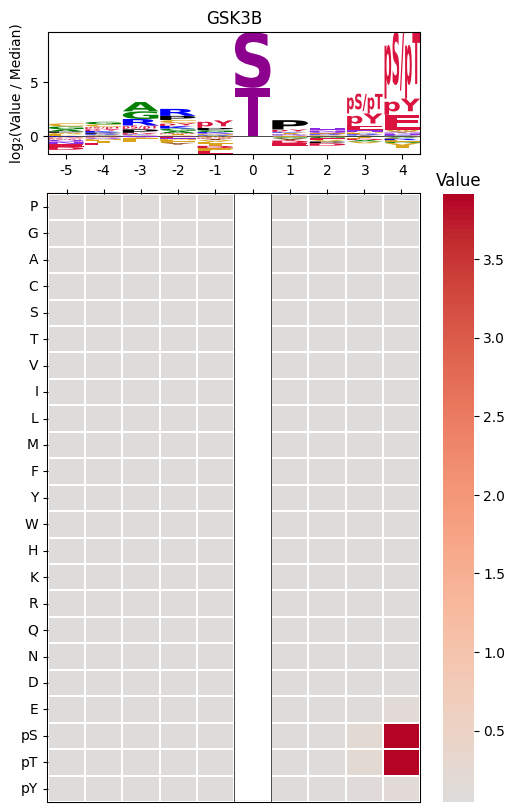
plot_logo_heatmap_pspa(row, title, figsize, include_zero) — Creates a combined visualization with the sequence logo on top and a heatmap below, allowing detailed inspection of specificity values at each position.
plot_logo_heatmap_pspa( row=pspa.loc['GSK3B'], # single kinase row from Data.get_pspa() title='GSK3B', # plot title figsize=(6, 10), # figure dimensions (width, height) include_zero=False, # whether to include position 0 in heatmap)
Normalization Functions (old version)
raw2norm(df, PDHK) — Normalizes raw PSPA data following the method from Johnson et al. (Nature 2022). Column-normalizes by sum of 17 randomized amino acids (excluding S, T, C), scales cysteine by its median, and sets S/T values to position medians.
norm_df = raw2norm( df=kinase_df, # DataFrame with position as index, amino acids as columns PDHK=False, # True for PDHK1/PDHK4 (uses 16 amino acids, also excludes Y))
get_one_kinase(df, kinase, normalize, drop_s) — Extracts and reshapes data for a single kinase from the stacked PSPA DataFrame, optionally applying normalization.
kinase_data = get_one_kinase( df=data, # stacked DataFrame (kinase as index, position+aa as columns) kinase='PDHK1', # kinase name to extract normalize=False, # apply Johnson et al. normalization drop_s=True, # drop 's' row (duplicate of 't' in PSPA))
get_logo(df, kinase) — End-to-end function that takes raw stacked PSPA data and generates a sequence logo for a specific kinase, including proper S/T ratio calculation at position 0.
get_logo( df=raw_pspa_df, # stacked DataFrame with kinase as index, substrates as columns kinase='AAK1', # kinase name to visualize)
Setup
Plot
preprocess_pspa
def preprocess_pspa( pssm):
Drop row s as it’s a duplicate of t; rename t to pS/pT; calculate np.log2(pssm/pssm.median())
def raw2norm( df:DataFrame, # single kinase's df has position as index, and single amino acid as columns PDHK:bool=False, # whether this kinase belongs to PDHK family):
Specifically, > - matrices were column-normalized at all positions by the sum of the 17 randomized amino acids (excluding serine, threonine and cysteine), to yield PSSMs. >- PDHK1 and PDHK4 were normalized to the 16 randomized amino acids (excluding serine, threonine, cysteine and additionally tyrosine) >- The cysteine row was scaled by its median to be 1/17 (1/16 for PDHK1 and PDHK4). >- The serine and threonine values in each position were set to be the median of that position. >- The S0/T0 ratio was determined by summing the values of S and T rows in the matrix (SS and ST, respectively), accounting for the different S vs. T composition of the central (1:1) and peripheral (only S or only T) positions (Sctrl and Tctrl, respectively), and then normalizing to the higher value among the two (S0 and T0, respectively, Supplementary Note 1)
This function is usually implemented with the below function, with normalize being a bool argument.
get_one_kinase
def get_one_kinase( df:DataFrame, # stacked dataframe (paper's raw data) kinase:str, # a specific kinase normalize:bool=False, # normalize according to the paper; special for PDHK1/4 drop_s:bool=True, # drop s as s is a duplicates of t in PSPA):
Obtain a specific kinase data from stacked dataframe
Retreive a single kinase data from PSPA data that has an format of kinase as index and position+amino acid as column.
data = Data.get_pspa_st()
get_one_kinase(data,'PDHK1')
aa
A
C
D
E
F
G
H
I
K
L
...
P
Q
R
S
T
V
W
Y
t
y
position
-5
0.0594
0.0625
0.0589
0.0550
0.0775
0.0697
0.0687
0.0590
0.0515
0.0657
...
0.0451
0.0424
0.0594
0.0594
0.0594
0.0573
0.1001
0.0775
0.0583
0.0658
-4
0.0618
0.0621
0.0550
0.0511
0.0739
0.0715
0.0598
0.0601
0.0520
0.0614
...
0.0637
0.0552
0.0617
0.0608
0.0608
0.0519
0.0916
0.0739
0.0528
0.0752
-3
0.0608
0.0576
0.0499
0.0423
0.0803
0.0580
0.0674
0.0687
0.0481
0.0667
...
0.0570
0.0532
0.0532
0.0584
0.0584
0.0588
0.1113
0.0803
0.0416
0.0553
-2
0.0587
0.0655
0.0470
0.0437
0.0790
0.0890
0.0787
0.0533
0.0440
0.0637
...
0.0500
0.0543
0.0616
0.0565
0.0565
0.0519
0.1082
0.0790
0.0327
0.0557
-1
0.0782
0.1009
0.0989
0.0426
0.0650
0.0695
0.0782
0.0496
0.0409
0.0578
...
0.0540
0.0500
0.0469
0.0594
0.0594
0.0514
0.0756
0.0650
0.0358
0.0433
0
NaN
NaN
NaN
NaN
NaN
NaN
NaN
NaN
NaN
NaN
...
NaN
NaN
NaN
1.0000
0.4886
NaN
NaN
0.0000
0.4886
0.0000
1
0.0400
0.0562
0.0394
0.0355
0.0735
0.0400
0.0502
0.1288
0.0390
0.1439
...
0.0379
0.0455
0.0455
0.0455
0.0455
0.0797
0.0784
0.0735
0.0336
0.0452
2
0.0496
0.0783
0.0643
0.0555
0.0720
0.1067
0.0684
0.0480
0.0505
0.0555
...
0.0564
0.0653
0.0695
0.0601
0.0601
0.0508
0.0672
0.0720
0.0414
0.0594
3
0.0486
0.0609
0.0938
0.0684
0.1024
0.0676
0.0544
0.0583
0.0388
0.0552
...
0.0686
0.0502
0.0561
0.0588
0.0588
0.0593
0.0641
0.1024
0.0539
0.0431
4
0.0565
0.0749
0.0631
0.0535
0.0732
0.0655
0.0664
0.0625
0.0496
0.0552
...
0.0677
0.0553
0.0604
0.0626
0.0626
0.0579
0.0864
0.0732
0.0548
0.0575
10 rows × 22 columns
get_logo
def get_logo( df:DataFrame, # stacked Dataframe with kinase as index, substrates as columns kinase:str, # a specific kinase name in index):
Given stacked df (index as kinase, columns as substrates), get a specific kinase’s logo