Requirement already satisfied: reactome2py in /system/conda/miniconda3/envs/cloudspace/lib/python3.10/site-packages (3.0.0)
Requirement already satisfied: requests in /system/conda/miniconda3/envs/cloudspace/lib/python3.10/site-packages (from reactome2py) (2.32.3)
Requirement already satisfied: pandas>=0.24.2 in /system/conda/miniconda3/envs/cloudspace/lib/python3.10/site-packages (from reactome2py) (2.1.4)
Requirement already satisfied: json5>=0.8.4 in /system/conda/miniconda3/envs/cloudspace/lib/python3.10/site-packages (from reactome2py) (0.9.25)
Requirement already satisfied: numpy<2,>=1.22.4 in /system/conda/miniconda3/envs/cloudspace/lib/python3.10/site-packages (from pandas>=0.24.2->reactome2py) (1.26.2)
Requirement already satisfied: python-dateutil>=2.8.2 in /system/conda/miniconda3/envs/cloudspace/lib/python3.10/site-packages (from pandas>=0.24.2->reactome2py) (2.9.0.post0)
Requirement already satisfied: pytz>=2020.1 in /system/conda/miniconda3/envs/cloudspace/lib/python3.10/site-packages (from pandas>=0.24.2->reactome2py) (2024.1)
Requirement already satisfied: tzdata>=2022.1 in /system/conda/miniconda3/envs/cloudspace/lib/python3.10/site-packages (from pandas>=0.24.2->reactome2py) (2024.1)
Requirement already satisfied: charset-normalizer<4,>=2 in /system/conda/miniconda3/envs/cloudspace/lib/python3.10/site-packages (from requests->reactome2py) (3.3.2)
Requirement already satisfied: idna<4,>=2.5 in /system/conda/miniconda3/envs/cloudspace/lib/python3.10/site-packages (from requests->reactome2py) (3.7)
Requirement already satisfied: urllib3<3,>=1.21.1 in /system/conda/miniconda3/envs/cloudspace/lib/python3.10/site-packages (from requests->reactome2py) (2.2.1)
Requirement already satisfied: certifi>=2017.4.17 in /system/conda/miniconda3/envs/cloudspace/lib/python3.10/site-packages (from requests->reactome2py) (2024.6.2)
Requirement already satisfied: six>=1.5 in /system/conda/miniconda3/envs/cloudspace/lib/python3.10/site-packages (from python-dateutil>=2.8.2->pandas>=0.24.2->reactome2py) (1.16.0)
from reactome2py import analysisfrom matplotlib import pyplot as pltfrom pandas import json_normalizeimport os, pandas as pd, numpy as np, seaborn as snsfrom tqdm import tqdmfrom PIL import Image
Utils
def get_reactome_raw(gene_list):"Reactome pathway analysis for a given gene set; returns raw output in dataframe." gene_str =','.join(gene_list)# set page size and page to -1 ensures to display all pathway results, sort by pvalue instead of fdr, projection set to True is consistent with official web result = analysis.identifiers(gene_str, page_size='-1', page='-1', sort_by='ENTITIES_PVALUE',projection=True) out = json_normalize(result['pathways'])return out
Example:
# get gene listgenes = pd.read_csv('raw/AKT1.csv')['gene'].tolist()get_reactome_raw(genes).head()
stId
dbId
name
llp
inDisease
species.dbId
species.taxId
species.name
entities.resource
entities.total
entities.found
entities.ratio
entities.pValue
entities.fdr
entities.exp
reactions.resource
reactions.total
reactions.found
reactions.ratio
0
R-HSA-111465
111465
Apoptotic cleavage of cellular proteins
True
False
48887
9606
Homo sapiens
TOTAL
38
33
0.002410
0.000122
0.294802
[]
TOTAL
38
38
0.002490
1
R-HSA-5674400
5674400
Constitutive Signaling by AKT1 E17K in Cancer
True
True
48887
9606
Homo sapiens
TOTAL
29
25
0.001839
0.000828
0.877515
[]
TOTAL
18
18
0.001179
2
R-HSA-75153
75153
Apoptotic execution phase
True
False
48887
9606
Homo sapiens
TOTAL
54
39
0.003424
0.001119
0.877515
[]
TOTAL
57
57
0.003735
3
R-HSA-3108232
3108232
SUMO E3 ligases SUMOylate target proteins
False
False
48887
9606
Homo sapiens
TOTAL
184
104
0.011668
0.002038
0.877515
[]
TOTAL
132
102
0.008649
4
R-HSA-2990846
2990846
SUMOylation
False
False
48887
9606
Homo sapiens
TOTAL
193
107
0.012238
0.003148
0.877515
[]
TOTAL
141
111
0.009239
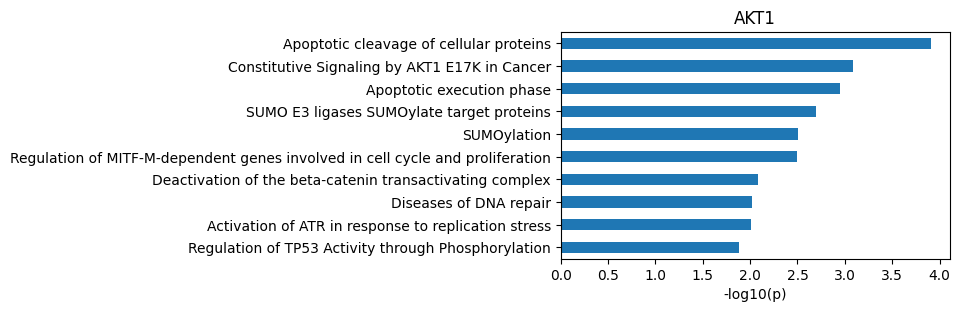
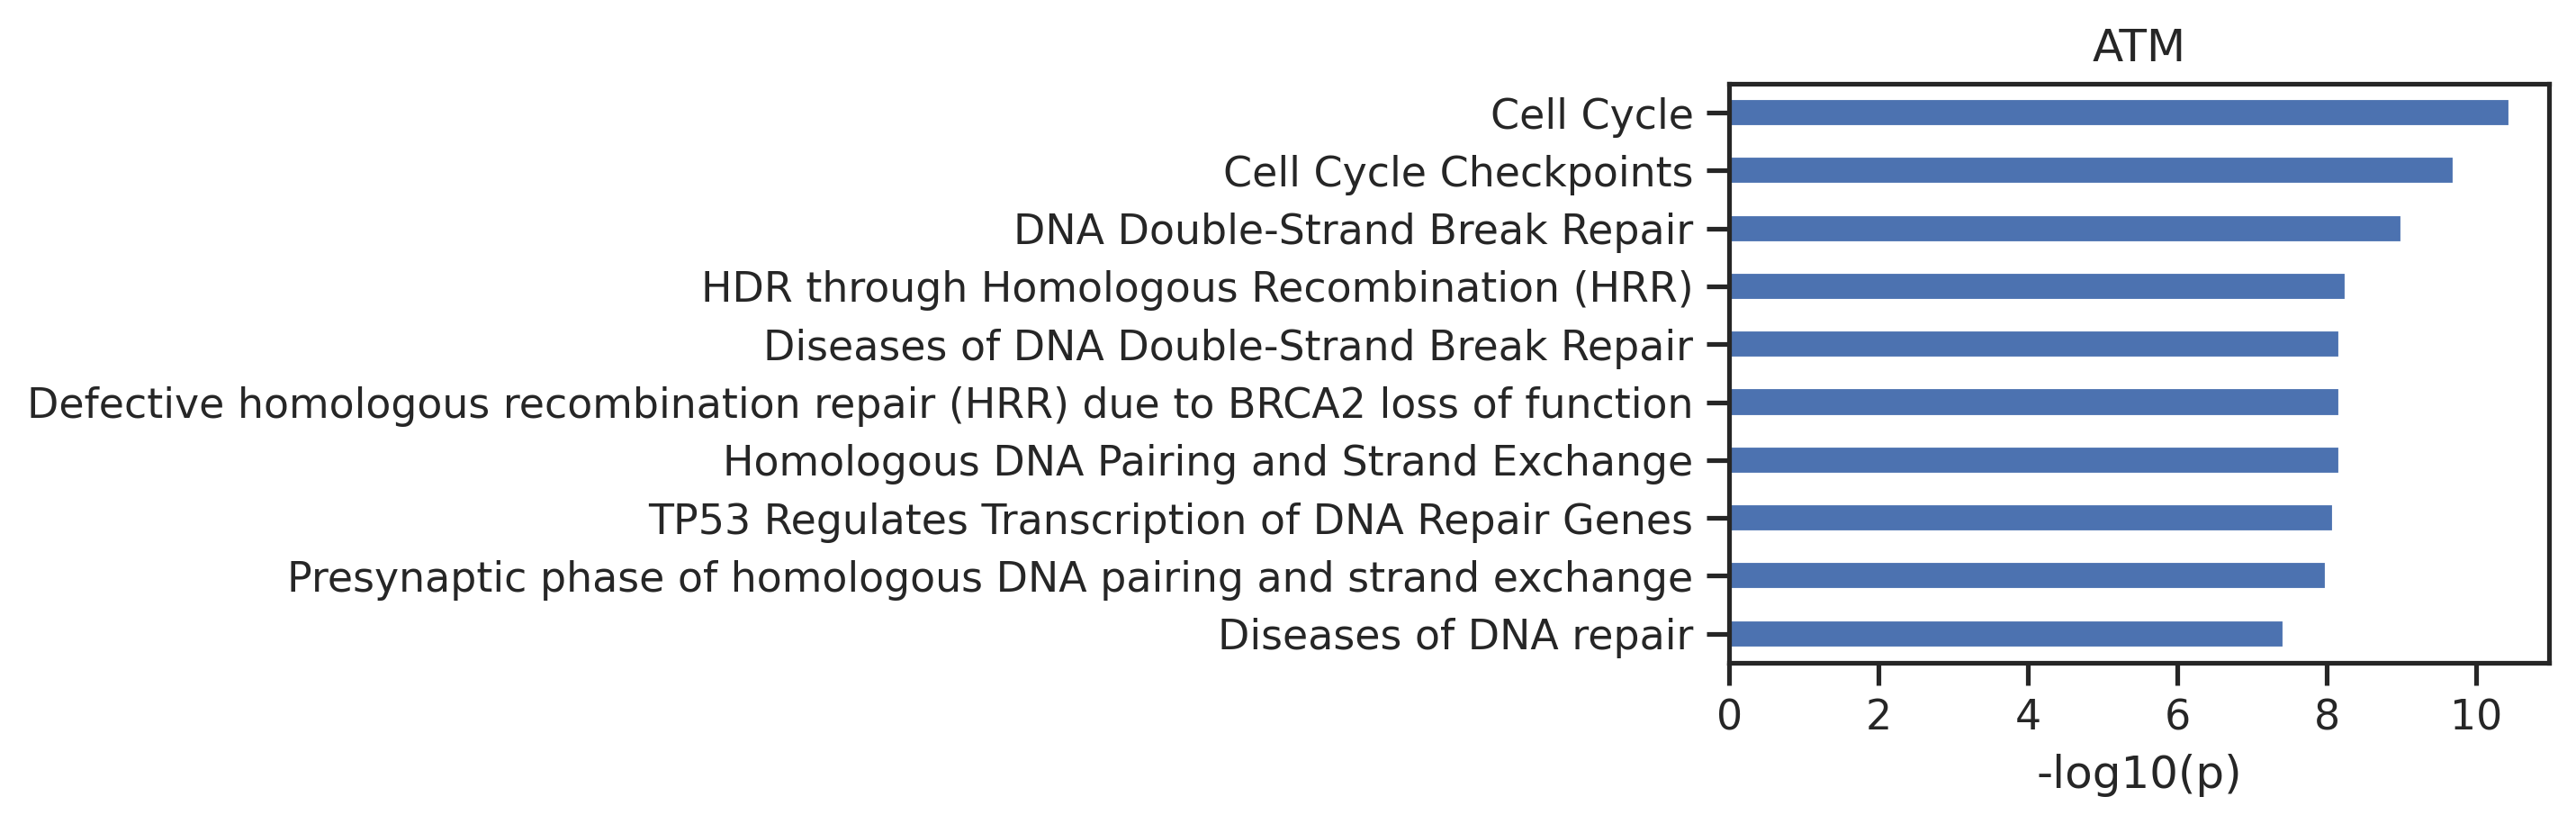
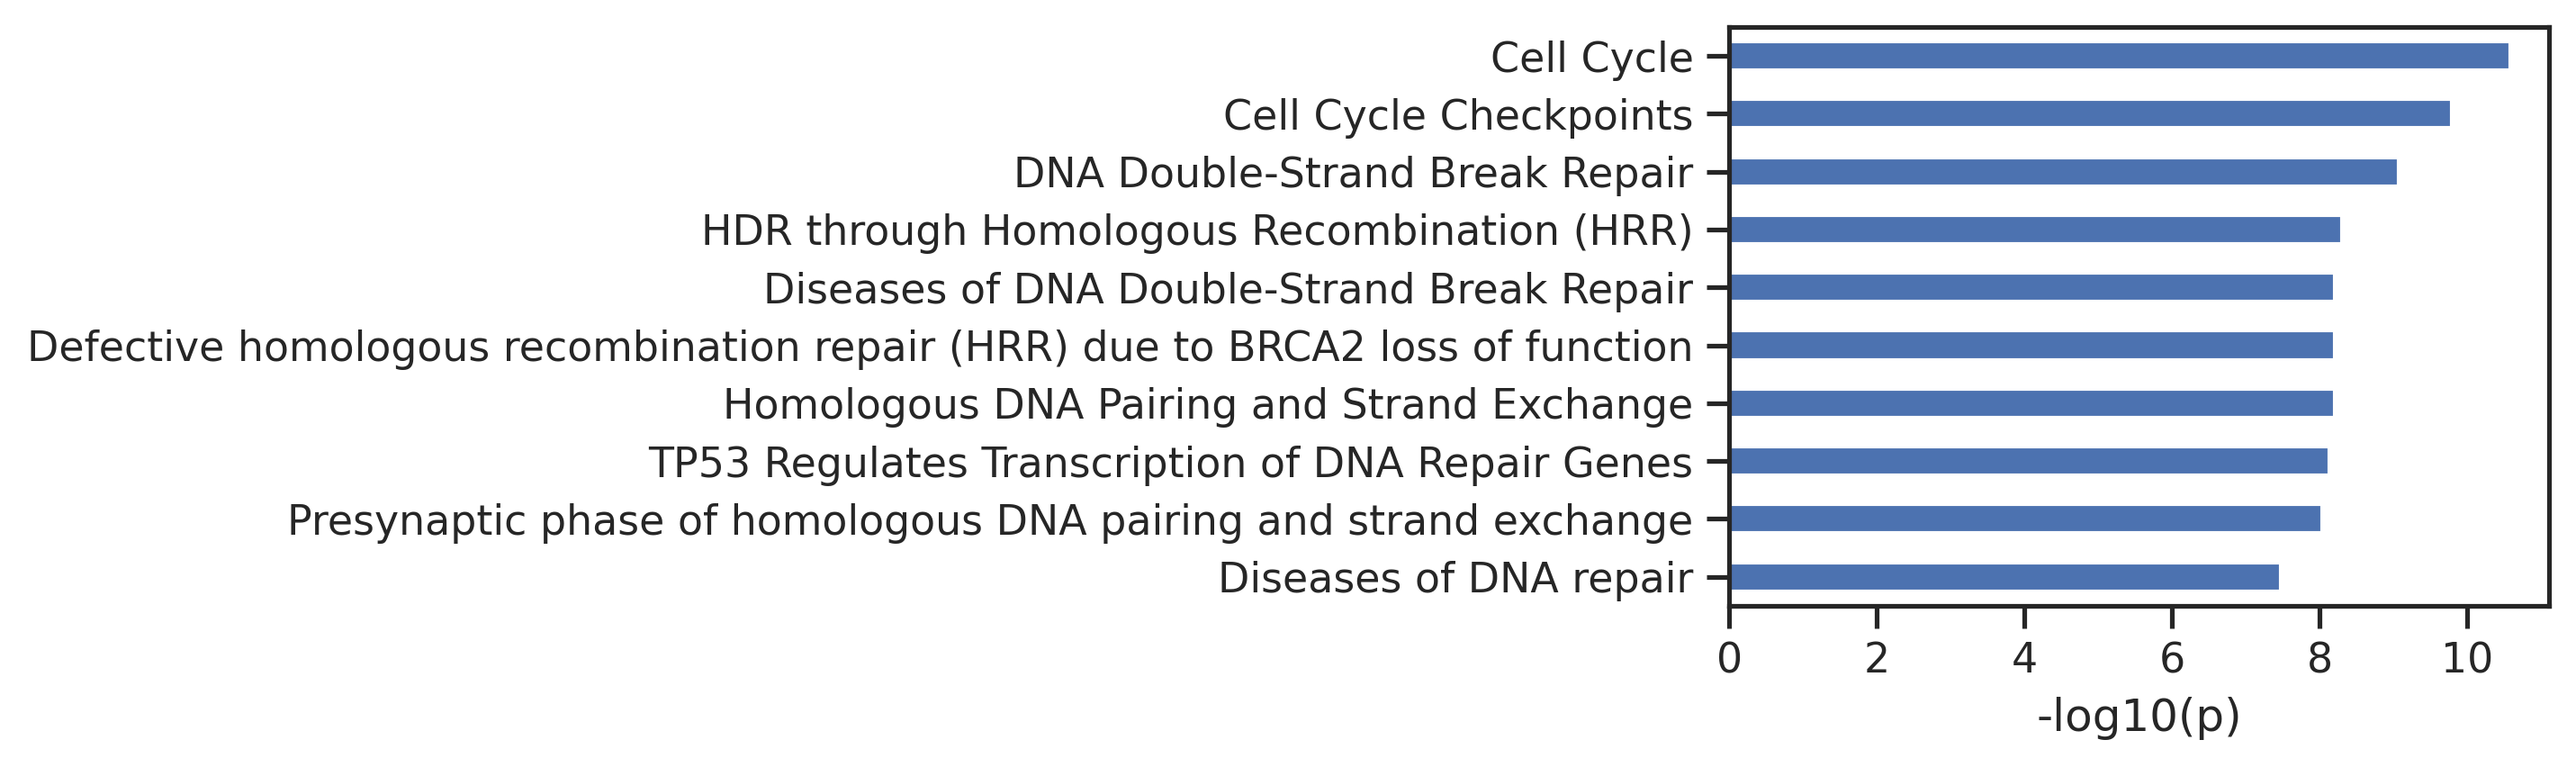
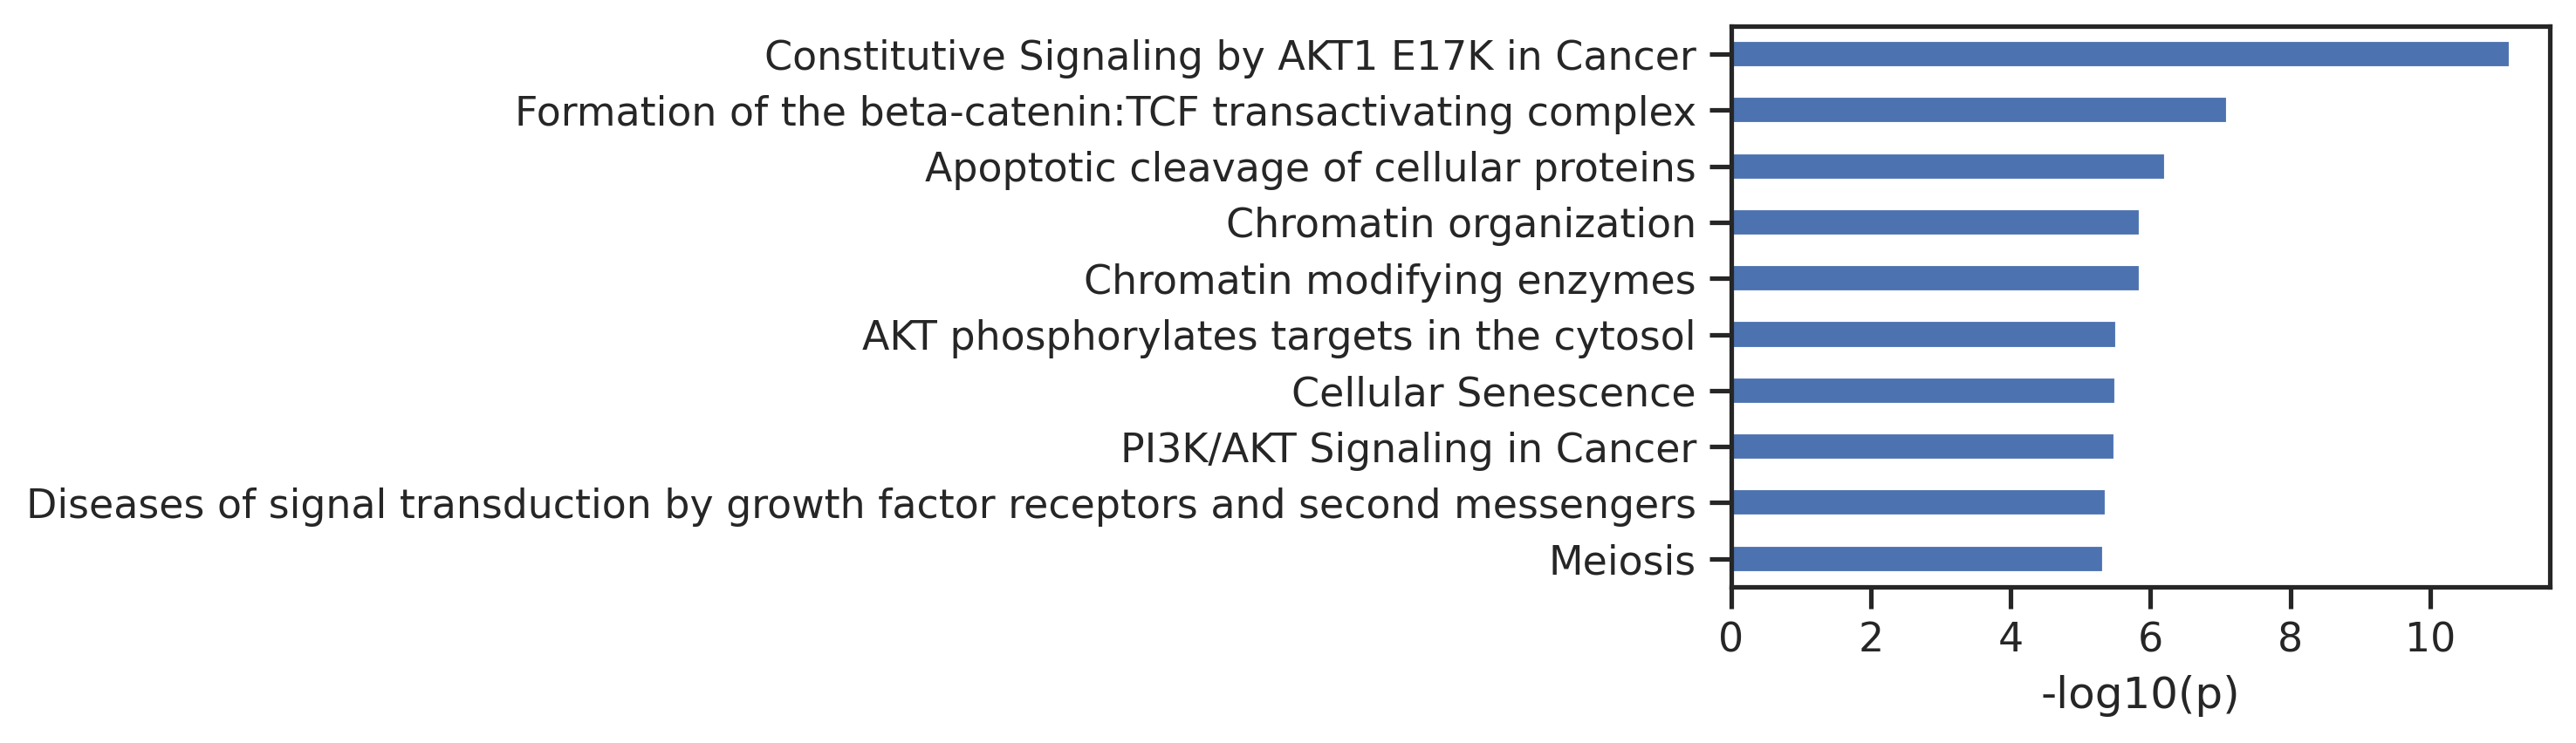
def plot_path(react_out, top_n=10,max_label_length=80):"Plot the output of get_reactome."# Extract the data and reverse it data = react_out.head(top_n).set_index('name')['-log10_pValue'].iloc[::-1]# Truncate labels if they are too long truncated_labels = [label[:max_label_length] +'...'iflen(label) > max_label_length else label for label in data.index] data.index = truncated_labels# Calculate the required width: base width + additional width for the longest label base_width =2 max_label_length =max(data.index, key=len) additional_width =len(max_label_length) *0.1# Adjust scaling factor as needed figsize = (base_width + additional_width, 3*top_n/10) # Adjust height as necessary# Plotting data.plot.barh(figsize=figsize) plt.ylabel('') plt.xlabel('-log10(p)') plt.tight_layout()
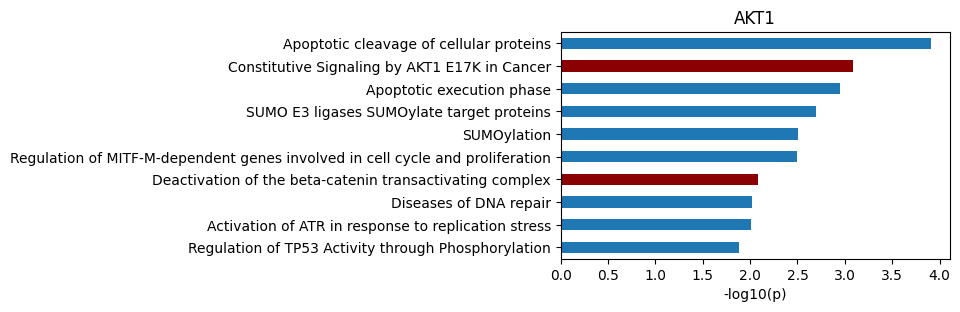
def plot_path(react_out, ref_df=None, top_n=10, max_label_length=80 ):""" Plot the output of get_reactome. If ref_df is provided, bars corresponding to pathways in ref_df are shown in dark red. """import matplotlib.pyplot as plt# Take top_n rows subset = react_out.head(top_n)# Determine bar colors: if ref_df is provided, highlight matching pathwaysif ref_df isnotNone: ref_ids =set(ref_df['reactome_id']) colors = ['darkred'if rid in ref_ids else'C0'for rid in subset['reactome_id']]else: colors ='C0'# Reverse order for horizontal bar plot data = subset.set_index('name')['-log10_pValue'].iloc[::-1]# If colors is a list, reverse it to match the data orderifisinstance(colors, list): colors =list(reversed(colors))# Truncate labels if too long truncated_labels = [label[:max_label_length] +'...'iflen(label) > max_label_length else label for label in data.index] data.index = truncated_labels# Calculate figure width based on label length base_width =2 max_label =max(data.index, key=len) additional_width =len(max_label) *0.1# adjust scaling factor as needed figsize = (base_width + additional_width, 3* top_n /10) data.plot.barh(figsize=figsize, color=colors) plt.ylabel('') plt.xlabel('-log10(p)') plt.tight_layout()
plot_path(out_df,ref_df)plt.title('AKT1');
def get_reactome(gene_list, plot=True):"Given a gene list, get the processed output of reactome; output contains additional -log10(p)" out = get_reactome_raw(gene_list) out = out[['stId','name','entities.pValue']] out.columns = ['reactome_id','name','pValue'] out['-log10_pValue'] =-np.log10(out['pValue']).round(3)if plot: plot_pathreturn out
def get_rank(r_id): ranks = out_df.index[out_df['reactome_id'] == r_id].tolist()return ranks[0] +1if ranks elseNone# Return None if not found# Apply the function to ref_dfref_df['rank_in_out'] = ref_df['reactome_id'].apply(get_rank)
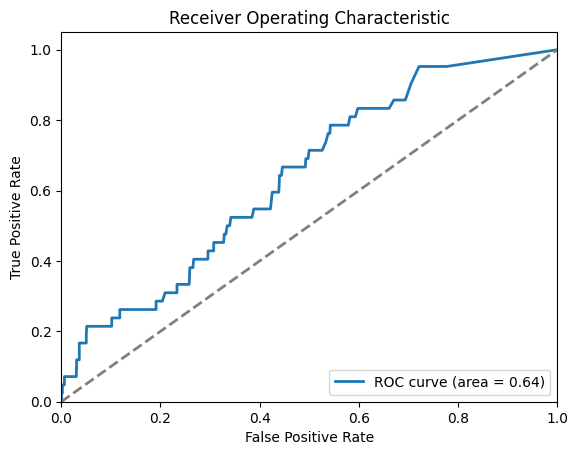
import pandas as pdfrom sklearn.metrics import precision_score, recall_score, f1_score, roc_auc_score# Assuming ref_df and out_df are your dataframesref_ids =set(ref_df['reactome_id'])out_df['is_ref'] = out_df['reactome_id'].isin(ref_ids)# Define predicted positives using a pValue thresholdthreshold =0.05out_df['predicted'] = out_df['pValue'] <= threshold# Calculate metrics# precision = precision_score(out_df['is_ref'], out_df['predicted'])# recall = recall_score(out_df['is_ref'], out_df['predicted'])# f1 = f1_score(out_df['is_ref'], out_df['predicted'])roc_auc = roc_auc_score(out_df['is_ref'], out_df['-log10_pValue'])# print("Precision:", precision)# print("Recall:", recall)# print("F1 Score:", f1)print("ROC-AUC:", roc_auc)import matplotlib.pyplot as pltfrom sklearn.metrics import roc_curve, auc# Compute false positive rate (fpr) and true positive rate (tpr)fpr, tpr, thresholds = roc_curve(out_df['is_ref'], out_df['-log10_pValue'])# Calculate the area under the curve (AUC)roc_auc = auc(fpr, tpr)# Create the ROC curve plotplt.figure()plt.plot(fpr, tpr, lw=2, label=f'ROC curve (area = {roc_auc:0.2f})')plt.plot([0, 1], [0, 1], lw=2, linestyle='--', color='gray')plt.xlim([0.0, 1.0])plt.ylim([0.0, 1.05])plt.xlabel('False Positive Rate')plt.ylabel('True Positive Rate')plt.title('Receiver Operating Characteristic')plt.legend(loc="lower right")plt.show()
ROC-AUC: 0.6408955320666624
Run
from katlas.core import*from katlas.plot import*
For the original human phosphoproteome (all-uppercase):
site= Data.get_combine_site_psp_ochoa()
For phosphorylated human phosphoproteome, uncheck below:
# site = Data.get_combine_site_phosphorylated()
For PSP site, uncheck below:
# site = Data.get_psp_human_site()# site['acceptor'] = site.site_seq.str[7]# # remove none sty-phosphoacceptor sequence# site = site['acceptor'].isin(['s','t','y'])]# # convert lowercase other than s,t,y to capital; convert rare aa to _# site['site_seq'] = site.site_seq.apply(convert_string)# site = site.reset_index(drop=True)# site.to_parquet('PSP_human_processed_sites.parquet')# site = pd.read_parquet('PSP_human_processed_sites.parquet')
As the original phosphoproteome is an all-uppercase dataset, we choose param to be param_CDDM_upper
param = param_CDDM_upper## for phosphorylated dataset, we will choose the standard param# param = param_CDDM## or# param = param_PSPA
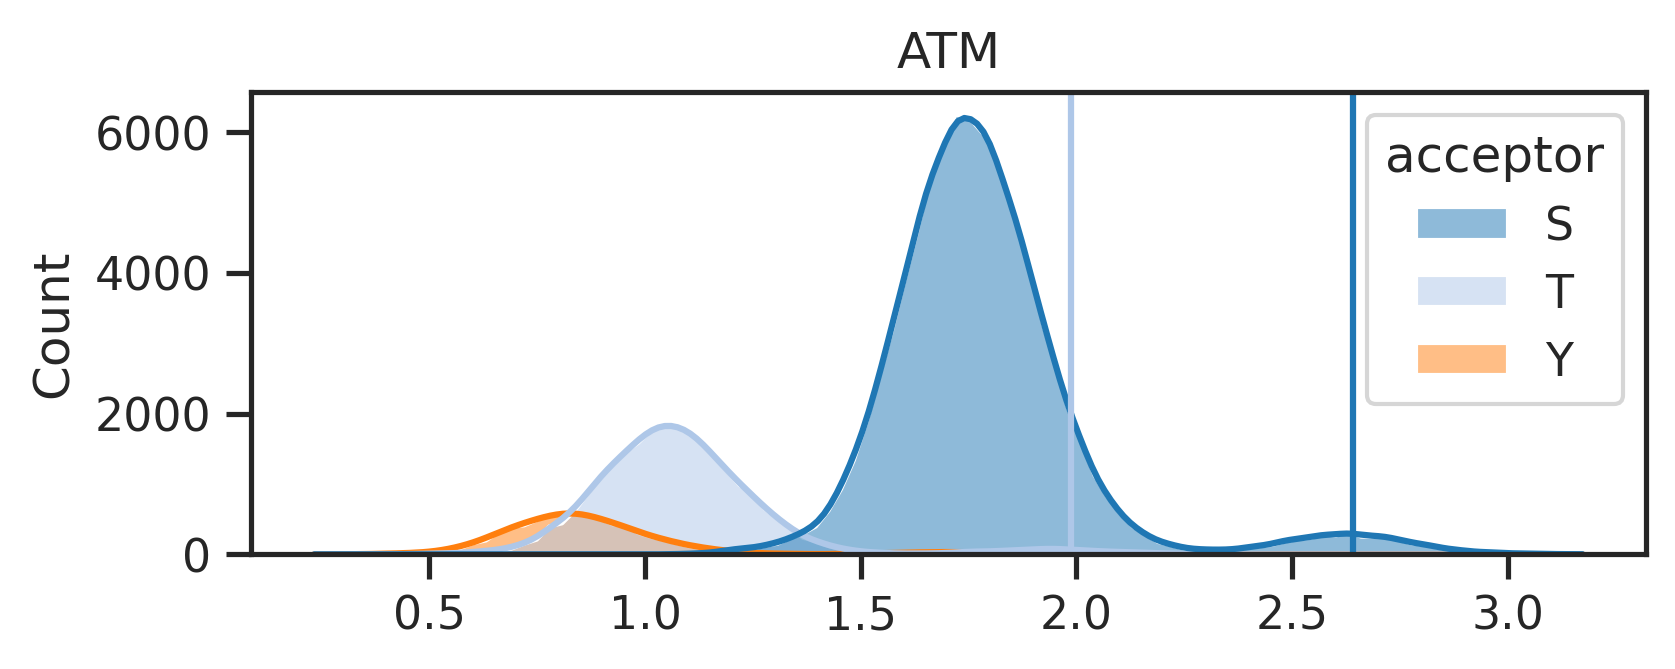
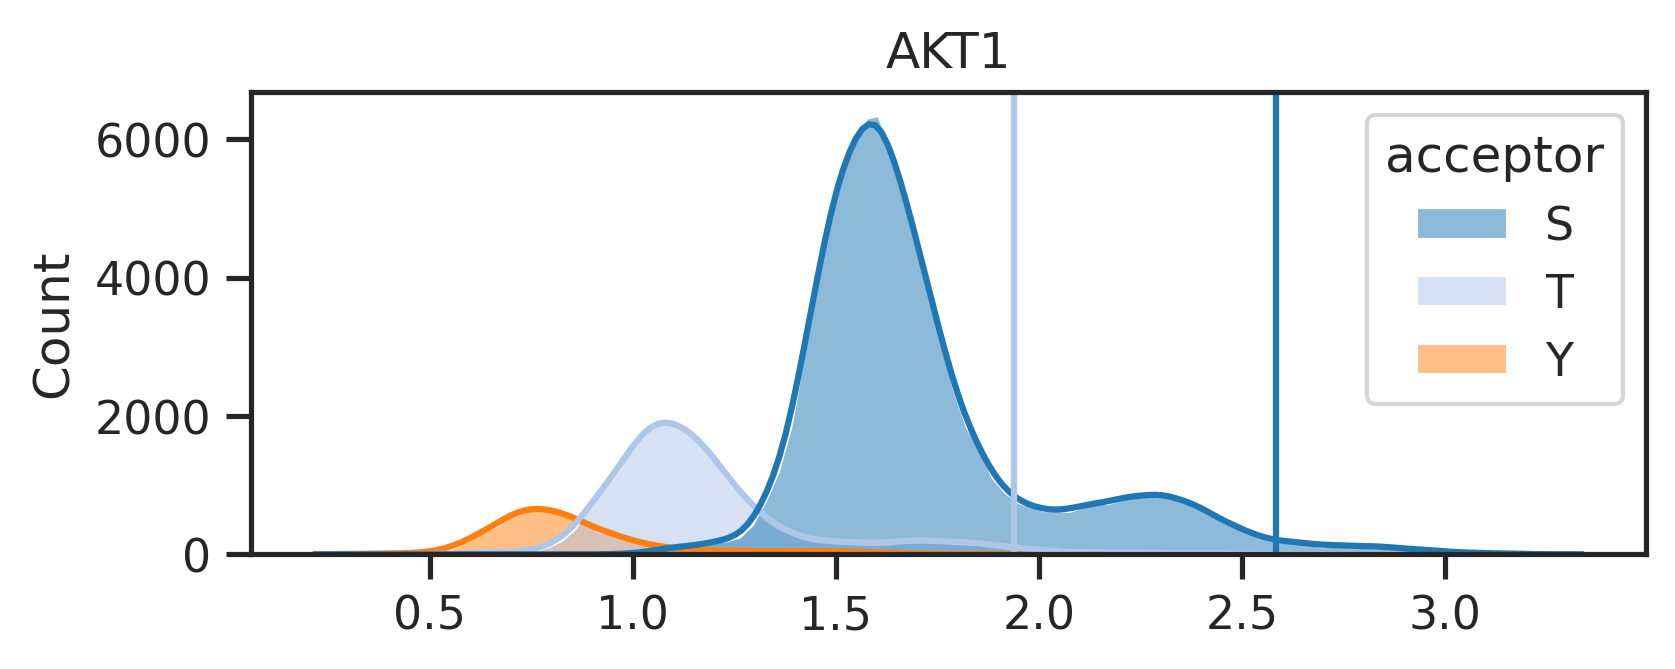
The above line will create two folders under the {save_folder}: - path_fig folder contains the pathway analysis. - score_distribute folder contains histogram of score distribution.
Combine images for pdf
def combine_images_vertically(image_paths, output_path):# Open images and convert them to 'RGBA' for uniformity images = [Image.open(image_path).convert('RGBA') for image_path in image_paths]# Calculate the total width as the maximum width of any image total_width =max(image.width for image in images)# Calculate the total height by summing the heights of all images total_height =sum(image.height for image in images)# set the background white board size# total_width, total_height = 2010,1200 total_width, total_height =3000,1750# Create a new image with a white background in 'RGBA' mode combined_image = Image.new('RGBA', (total_width, total_height), (255, 255, 255, 255))# Initialize the y_offset to start pasting images from the top y_offset =0for image in images:# Calculate the x position to center the image x_offset = (total_width - image.width) //2# Paste the current image into the combined image combined_image.paste(image, (x_offset, y_offset), image)# Update the y_offset to move to the next position for the next image y_offset += image.height# Save the combined image to the specified output path combined_image.save(output_path)
Uncheck below to merge the pathway figures and score distribution figures together:
# folders = ["test/score_distribute", "test/path_fig"]# for k in tqdm(ref.index):# filename = f"{k}.png"# image_paths = [os.path.join(folder, filename) for folder in folders]# output_path = Path(f"test/combine/{k}.png")# output_path.parent.mkdir(parents=True,exist_ok=True)# combine_images_vertically(image_paths, output_path)