heatmap

Similarity, matrix, and confusion plots.
df = sns.load_dataset('titanic').dropna(subset=['age', 'fare', 'class', 'sex', 'survived']).reset_index(drop=True)
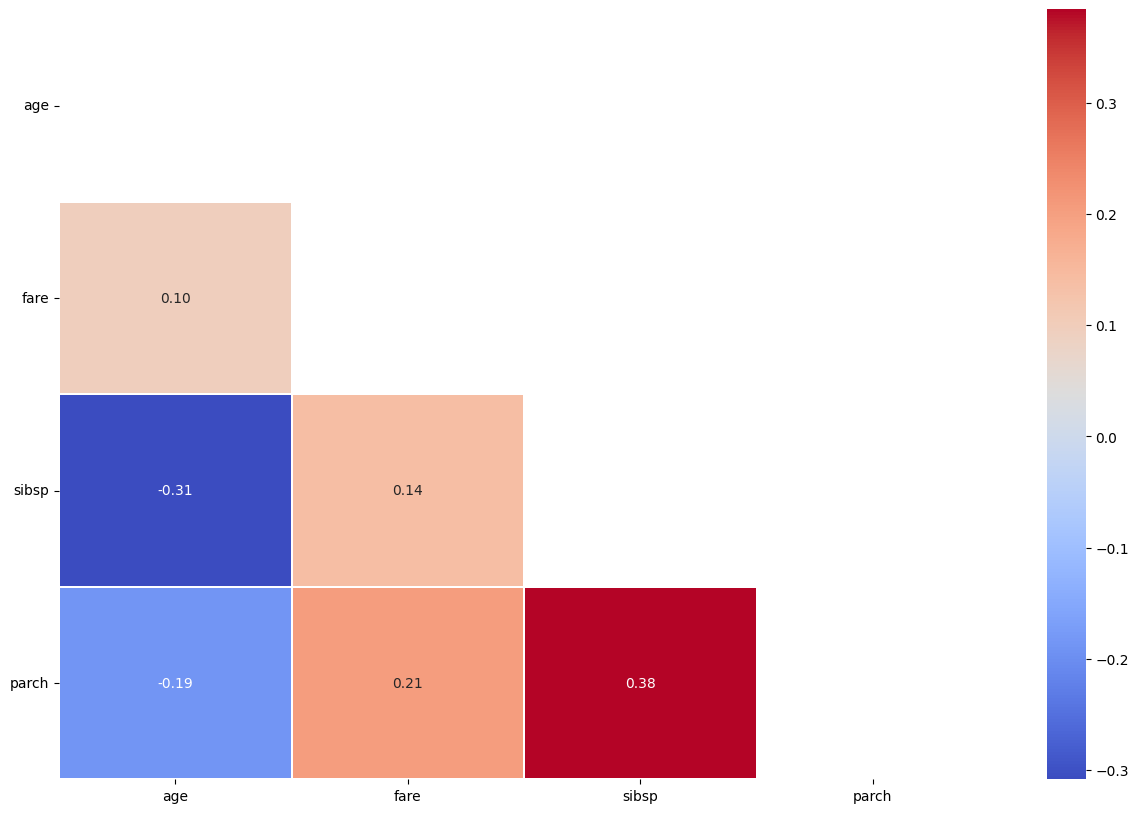
df2 = df[['age', 'fare', 'sibsp', 'parch']].head(8).copy()
df2.index = [f'row_{i}' for i in range(len(df2))]
print(df.shape)
print(df2.shape)
(714, 15)
(8, 4)
df.head()
survived pclass sex age sibsp parch fare embarked class who adult_male deck embark_town alive alone
0 0 3 male 22.0 1 0 7.2500 S Third man True NaN Southampton no False
1 1 1 female 38.0 1 0 71.2833 C First woman False C Cherbourg yes False
2 1 3 female 26.0 0 0 7.9250 S Third woman False NaN Southampton yes True
3 1 1 female 35.0 1 0 53.1000 S First woman False C Southampton yes False
4 0 3 male 35.0 0 0 8.0500 S Third man True NaN Southampton no True

Matrix Helpers


get_similarity


def get_similarity(
    df:DataFrame, # numeric feature matrix indexed by sample name
    metric:str='euclidean', # pairwise_distances metric name
)->tuple:

Calculate both distance and similarity matrices for a dataframe.

get_similarity(df2)[0]
row_0 row_1 row_2 row_3 row_4 row_5 row_6 row_7
row_0 0.000000 66.001996 4.177993 47.657345 13.062925 54.911521 24.415786 6.714166
row_1 66.001996 0.000000 64.492435 18.429118 63.312323 25.182682 61.821302 61.188418
row_2 4.177993 64.492435 0.000000 46.073643 9.000868 52.100901 27.548548 3.910651
row_3 47.657345 18.429118 46.073643 0.000000 45.061097 19.066500 46.039121 42.780883
row_4 13.062925 63.312323 9.000868 45.061097 0.000000 47.754949 35.618122 8.803791
row_5 54.911521 25.182682 52.100901 19.066500 47.754949 0.000000 60.513388 48.906725
row_6 24.415786 61.821302 27.548548 46.039121 35.618122 60.513388 0.000000 27.089433
row_7 6.714166 61.188418 3.910651 42.780883 8.803791 48.906725 27.089433 0.000000

plot_corr


def plot_corr(
    df_corr:DataFrame, # correlation, distance, or similarity matrix
    mask_method:str | None='upper', # upper, lower, or None
    inverse_color:bool=False, # reverse the colormap when True
    figsize:tuple=(15, 10), # figure size in inches
    annot:bool=True, # whether to annotate the matrix values
    linewidths:float=0.1, # cell border width
    kwargs:VAR_KEYWORD
):

Plot a square matrix with an optional triangular mask.

plot_corr(df[['age', 'fare', 'sibsp', 'parch']].corr(numeric_only=True))

Classification And Composition


plot_confusion_matrix


def plot_confusion_matrix(
    target, # true labels
    pred, # predicted labels
    class_names:list[str] | None=None, # labels shown on the axes
    normalize:bool=False, # normalize rows when True
    title:str='Confusion matrix', # plot title
    cmap:LinearSegmentedColormap=<matplotlib.colors.LinearSegmentedColormap object at 0x7f9d7e4ea5d0>, # matplotlib colormap
    figsize:tuple=(6, 6), # figure size in inches
    kwargs:VAR_KEYWORD
):

Plot a confusion matrix from target and prediction arrays.

plot_confusion_matrix(df['survived'], df['adult_male'], class_names=['False', 'True'], normalize=True)
Normalized confusion matrix