df0=sns.load_dataset("iris")
df0.head()| sepal_length | sepal_width | petal_length | petal_width | species | |
|---|---|---|---|---|---|
| 0 | 5.1 | 3.5 | 1.4 | 0.2 | setosa |
| 1 | 4.9 | 3.0 | 1.4 | 0.2 | setosa |
| 2 | 4.7 | 3.2 | 1.3 | 0.2 | setosa |
| 3 | 4.6 | 3.1 | 1.5 | 0.2 | setosa |
| 4 | 5.0 | 3.6 | 1.4 | 0.2 | setosa |
df0.species.value_counts()species
setosa 50
versicolor 50
virginica 50
Name: count, dtype: int64df = df0.drop(columns="species")Although pdist from scipy can calculate 1D distance of self matrix (row by row) with customized function, the function is limited without key on the vector. In this module, we’d like to make functions that can consider key in the vector when calculating distance between two vectors, so the input should take dataframe for datatable and pd.Series for vectors.
def my_distance(u, v):
    "Manhattan distance"
    return np.sum(np.abs(u - v))
A = np.array([[0, 0],
[1, 1],
[2, 2]])
pdist(A,metric=my_distance)array([2., 4., 2.])pdist(df,metric=my_distance)array([0.7, 0.8, 1. , ..., 1.2, 0.9, 1.5], shape=(11175,))pdist(df,metric=euclidean)array([0.53851648, 0.50990195, 0.64807407, ..., 0.6164414 , 0.64031242,
0.76811457], shape=(11175,))
def get_1d_distance(
    df, func_flat
):
Compute 1D distance (like pdist from scipy) but for df with column names
# return 1d distance
get_1d_distance(pd.DataFrame(A),func_flat=my_distance)
100%|██████████| 3/3 [00:00<00:00, 8823.92it/s]array([2, 4, 2])Parallel computing to accelerate when flattened pssms are too many in a df:
def get_1d_distance_parallel(
    df, func_flat, max_workers:int=4, chunksize:int=100
):
Parallel compute 1D distance for each row in a dataframe given a distance function
# get_1d_distance_parallel(df, func_flat=my_distance)
def get_Z(
    pssms, func_flat, method:str='ward', parallel:bool=True
):
Get linkage matrix Z from pssms dataframe
Z = get_Z(df,func_flat=euclidean,parallel=False)100%|██████████| 150/150 [00:00<00:00, 539.11it/s]CPU times: user 274 ms, sys: 5.29 ms, total: 279 ms
Wall time: 280 msZ[:5]array([[1.01e+02, 1.42e+02, 0.00e+00, 2.00e+00],
[7.00e+00, 3.90e+01, 1.00e-01, 2.00e+00],
[0.00e+00, 1.70e+01, 1.00e-01, 2.00e+00],
[9.00e+00, 3.40e+01, 1.00e-01, 2.00e+00],
[1.28e+02, 1.32e+02, 1.00e-01, 2.00e+00]])
def plot_dendrogram(
    Z, thr:float=0.07, dense:int=4, # the higher the more dense for each row
    line_width:int=1, title:NoneType=None, scale:int=1, kwargs:VAR_KEYWORD
):
Call self as a function.
plot_dendrogram(Z,dense=10,labels=df.index,thr=0.5)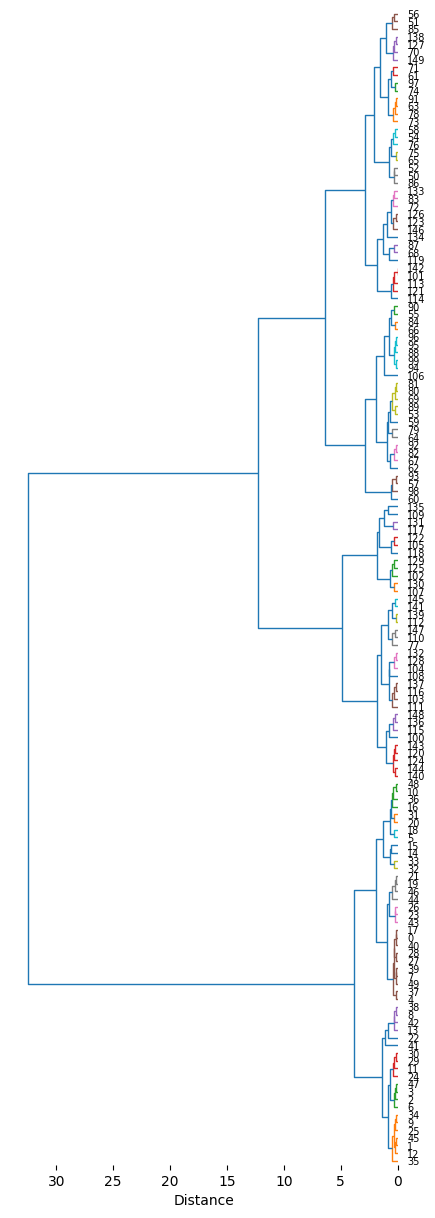
def get_hcluster(
    df, thr:float=0.07, plot:bool=True, labels:NoneType=None, func_flat:function=euclidean, method:str='ward',
    kwargs:VAR_KEYWORD
):
Get flat cluster assignments from hierarchical clustering linkage matrix Z.
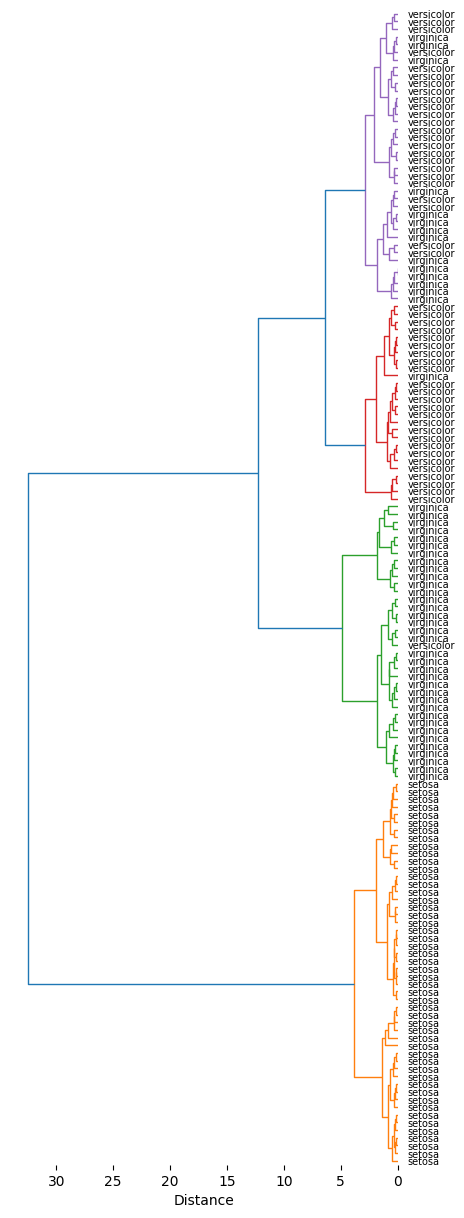
get_hcluster(df,labels=df0['species'].tolist(),thr=5,dense=10)0 1
1 1
2 1
3 1
4 1
..
145 2
146 4
147 2
148 2
149 4
Length: 150, dtype: int32