df = sns.load_dataset('tips')
df.shape
(244, 7)df = sns.load_dataset('tips')
df.shape(244, 7)df.head()| total_bill | tip | sex | smoker | day | time | size | |
|---|---|---|---|---|---|---|---|
| 0 | 16.99 | 1.01 | Female | No | Sun | Dinner | 2 |
| 1 | 10.34 | 1.66 | Male | No | Sun | Dinner | 3 |
| 2 | 21.01 | 3.50 | Male | No | Sun | Dinner | 3 |
| 3 | 23.68 | 3.31 | Male | No | Sun | Dinner | 2 |
| 4 | 24.59 | 3.61 | Female | No | Sun | Dinner | 4 |
def plot_rank(
    sorted_df:DataFrame, # dataframe already sorted by the ranking value
    x:str, # label column used for annotations
    y:str, # numeric ranking column
    n_hi:int | None=10, # number of items to annotate at the head
    n_lo:int | None=10, # number of items to annotate at the tail
    figsize:tuple=(10, 8), # figure size in inches
    data:NoneType=None, hue:NoneType=None, size:NoneType=None, style:NoneType=None, palette:NoneType=None,
    hue_order:NoneType=None, hue_norm:NoneType=None, sizes:NoneType=None, size_order:NoneType=None,
    size_norm:NoneType=None, markers:bool=True, style_order:NoneType=None, legend:str='auto', ax:NoneType=None
):
Plot a ranked scatter and annotate the highest and lowest entries.
sort_df=df.sort_values('total_bill').copy()
sort_df['id'] = sort_df.index.astype(str)
plot_rank(sort_df, x='id', y='total_bill', n_hi=10, n_lo=10)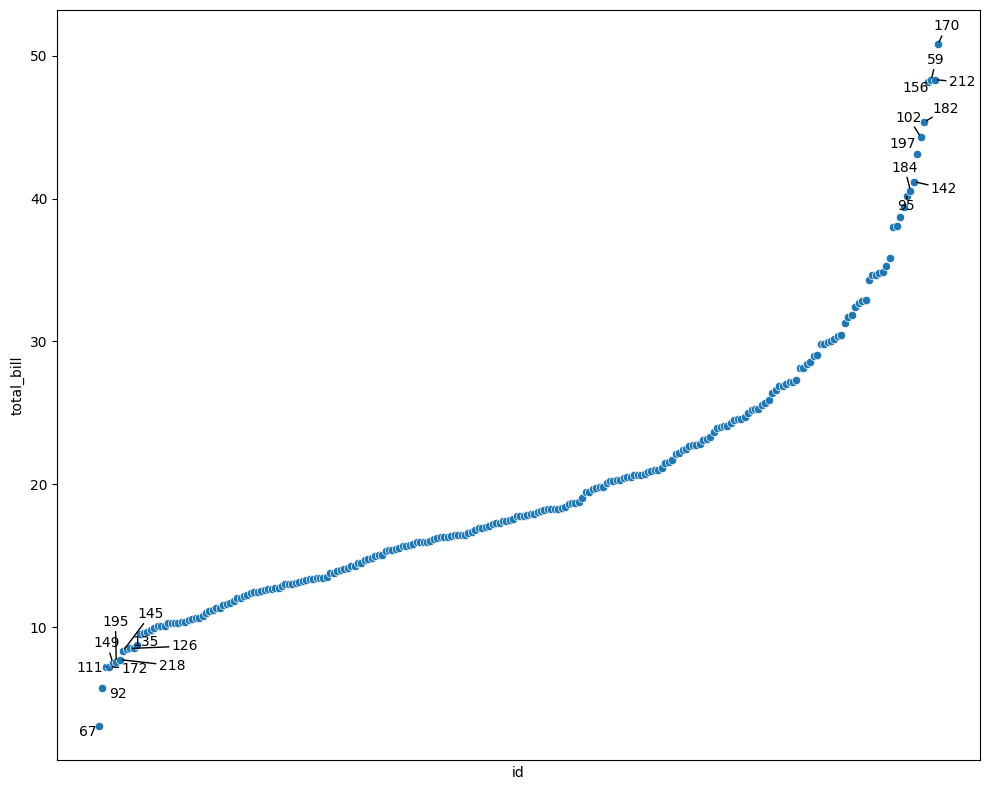
We compute the area under the empirical cumulative distribution function (CDF) as a function of kinase rank using the trapezoidal rule.
Let $ r_{(1)} < r_{(2)} < < r_{(n)} $ be the sorted rank values (e.g., \(1,2,\dots,n\)), and define the empirical CDF values as:
\[ F(r_{(i)}) = \frac{i}{n} \]
The normalized area under this CDF-vs-rank curve (AUCDF) is then computed via the trapezoidal rule:
\[ \text{AUC}_{\text{CDF}} = \frac{1}{r_{\max} - r_{\min}} \sum_{i=1}^{n-1} \frac{F(r_{(i)}) + F(r_{(i+1)})}{2} \cdot (r_{(i+1)} - r_{(i)}) \]
where $ r_{} = r_{(1)} $, typically 1; $ r_{} = r_{(n)} $, typically \(n\).
This measures how quickly the cumulative mass increases across the ranked kinases. If better kinases (lower rank) tend to appear earlier in the CDF, the AUCDF will be higher.
def get_AUCDF(
    df:DataFrame, # dataframe containing the ranking column
    col:str, # numeric ranking column
    reverse:bool=False, # flip the empirical CDF direction
    plot:bool=True, # whether to draw the histogram and CDF panels
    xlabel:str='Rank of kinase', # x-axis label for the histogram
    ylabel:str='Substrates', # y-axis label for the histogram
)->float:
Compute the normalized area under an empirical CDF over rank values.
get_AUCDF(df, 'total_bill', plot=True)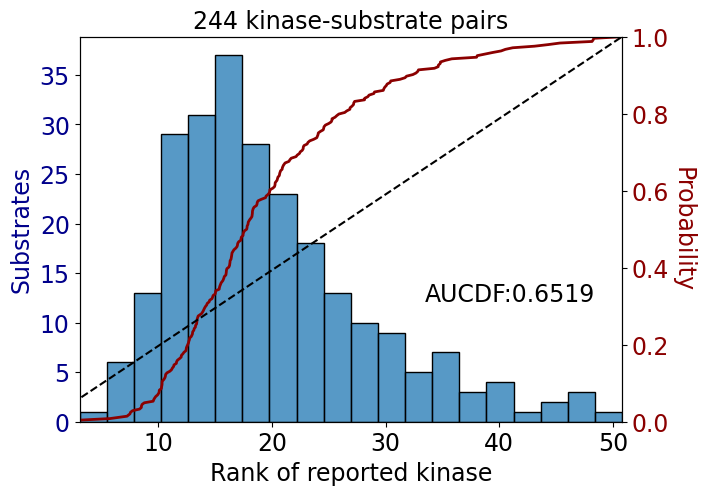
0.6519265042202643