import pandas as pd
import matplotlib.pyplot as plt
import numpy as np
import seaborn as sns
from matplotlib.colors import LogNorm
from katlas.core import *Exploratory data analysis
Setup
sns.set(rc={"figure.dpi":300, 'savefig.dpi':300})
sns.set_context('notebook')
sns.set_style("ticks")
Overlap between sources
# direct concatenate of all source sequence
df=pd.read_parquet('raw/combine_source.parquet')
# unique substrate site with source split by |
df_group=pd.read_parquet('raw/combine_source_grouped.parquet')def plot_overlap(df_concat,source_col='source',id_col='kin_sub_site',figsize=(7,5),title="Overlap of Unique KS Pairs Between Sources"):
source_ids = df_concat.groupby(source_col)[id_col].apply(set).to_dict()
sources = list(source_ids.keys())
overlap_matrix = pd.DataFrame(index=sources, columns=sources, dtype=int)
for src1 in sources:
for src2 in sources:
if src1 == src2:
overlap_matrix.loc[src1, src2] = len(source_ids[src1])
else:
overlap_matrix.loc[src1, src2] = len(source_ids[src1].intersection(source_ids[src2]))
mask = np.triu(np.ones_like(overlap_matrix, dtype=bool), k=1)
overlap_matrix = overlap_matrix.astype(int)
vmin = np.min(overlap_matrix[overlap_matrix > 0]) # Smallest nonzero value
vmax = np.max(overlap_matrix)
plt.figure(figsize=figsize)
sns.heatmap(overlap_matrix,
annot=True,
mask=mask,
fmt=",",
# vmin=1, vmax=1,
norm=LogNorm(vmin=vmin, vmax=vmax),
cmap="Blues",
cbar=False,
linewidths=1,
linecolor='white')
plt.title(title)plot_overlap(df)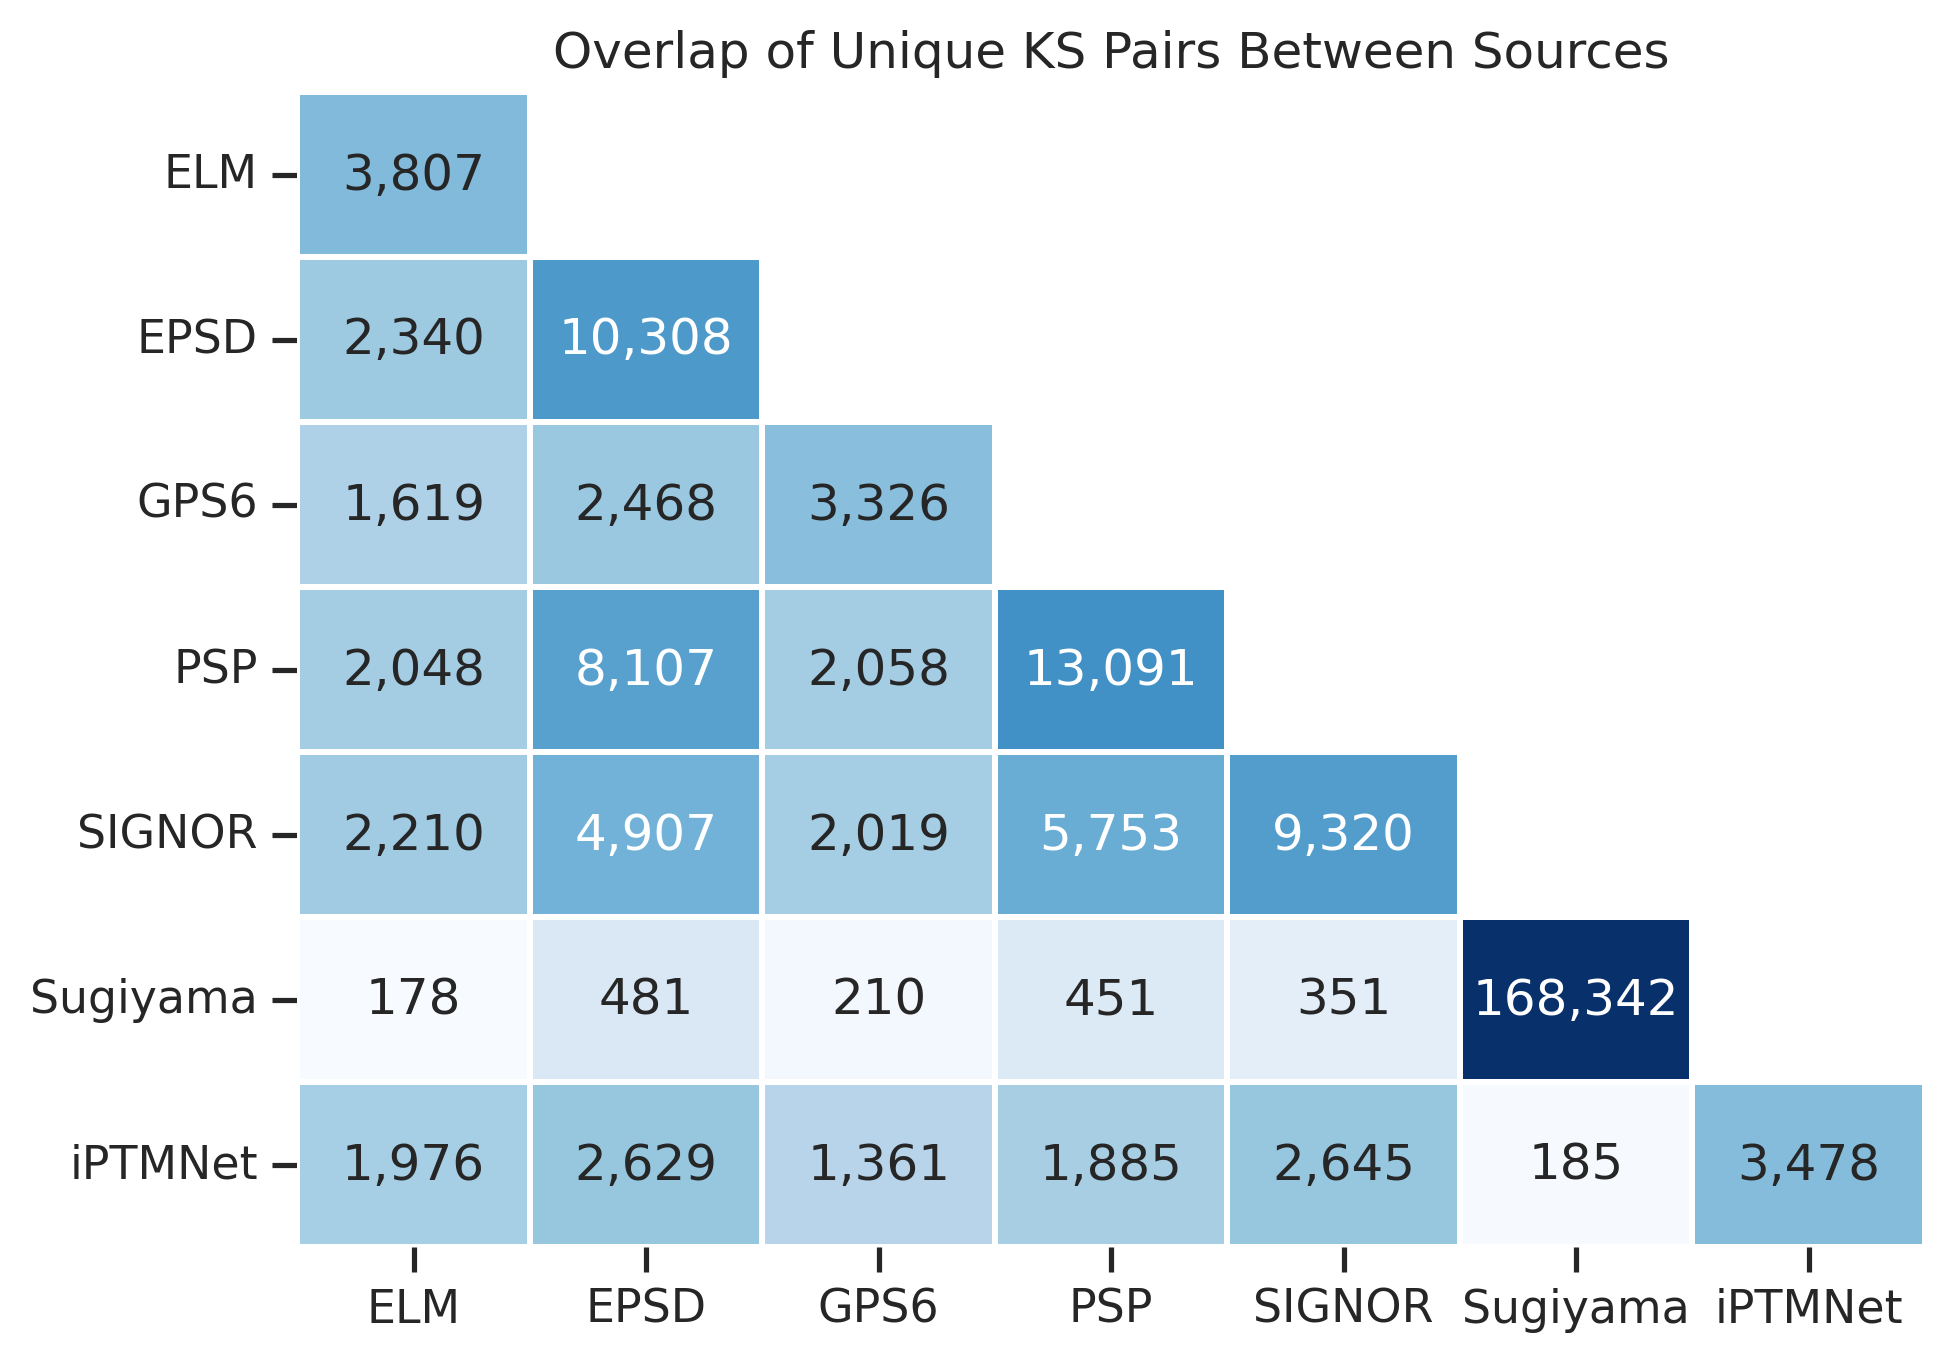
df.site.str[0].value_counts()site
Y 92088
S 84341
T 35243
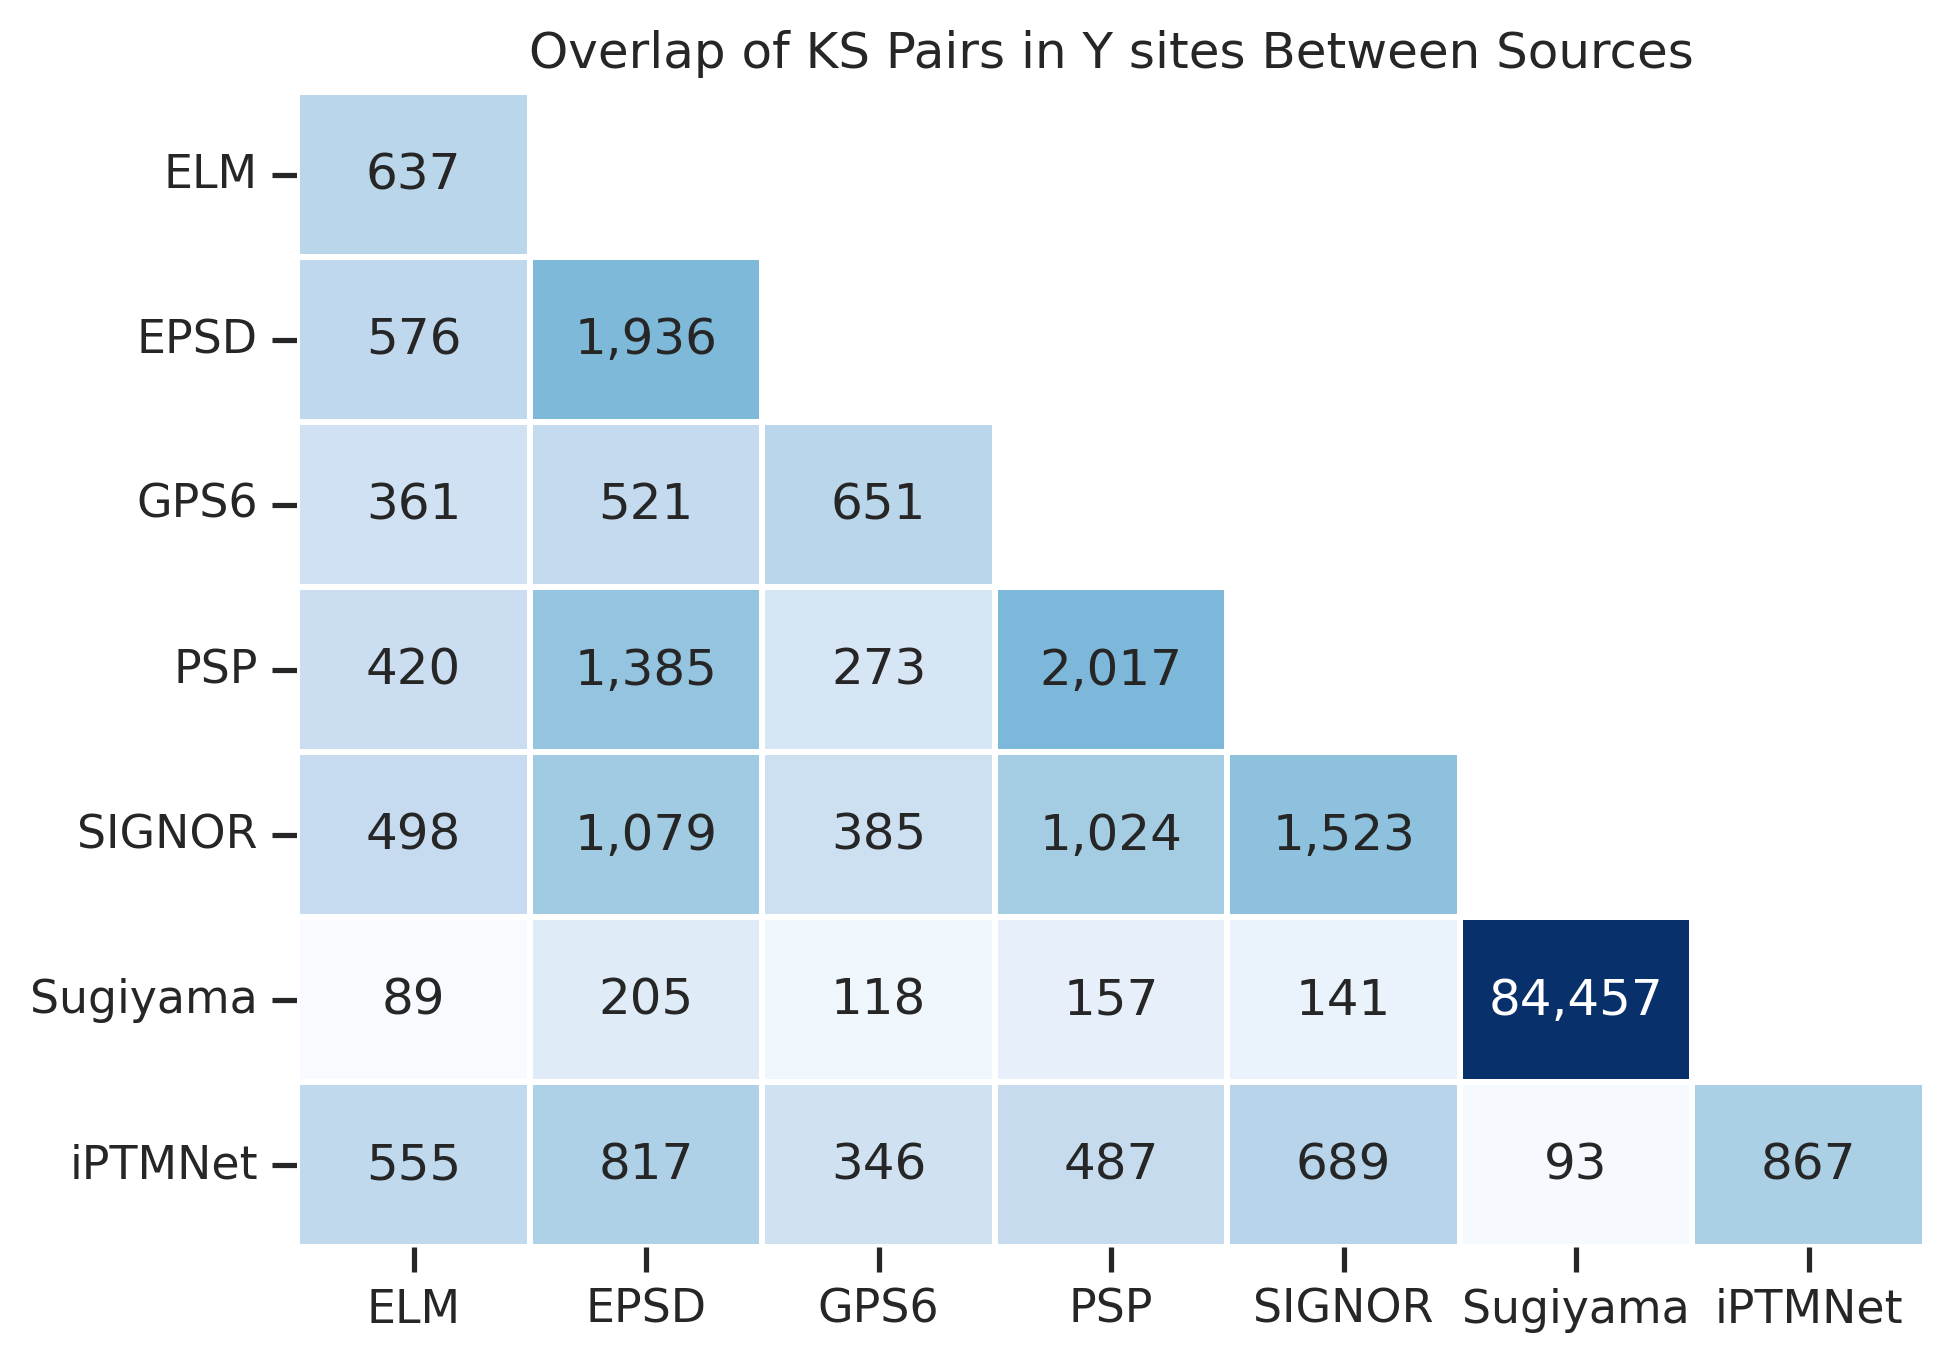
Name: count, dtype: int64df_st = df[df.site.str[0]!='Y']
df_y = df[df.site.str[0]=='Y']plot_overlap(df_st,title="Overlap of KS Pairs in S/T sites Between Sources")
plot_overlap(df_y,title="Overlap of KS Pairs in Y sites Between Sources")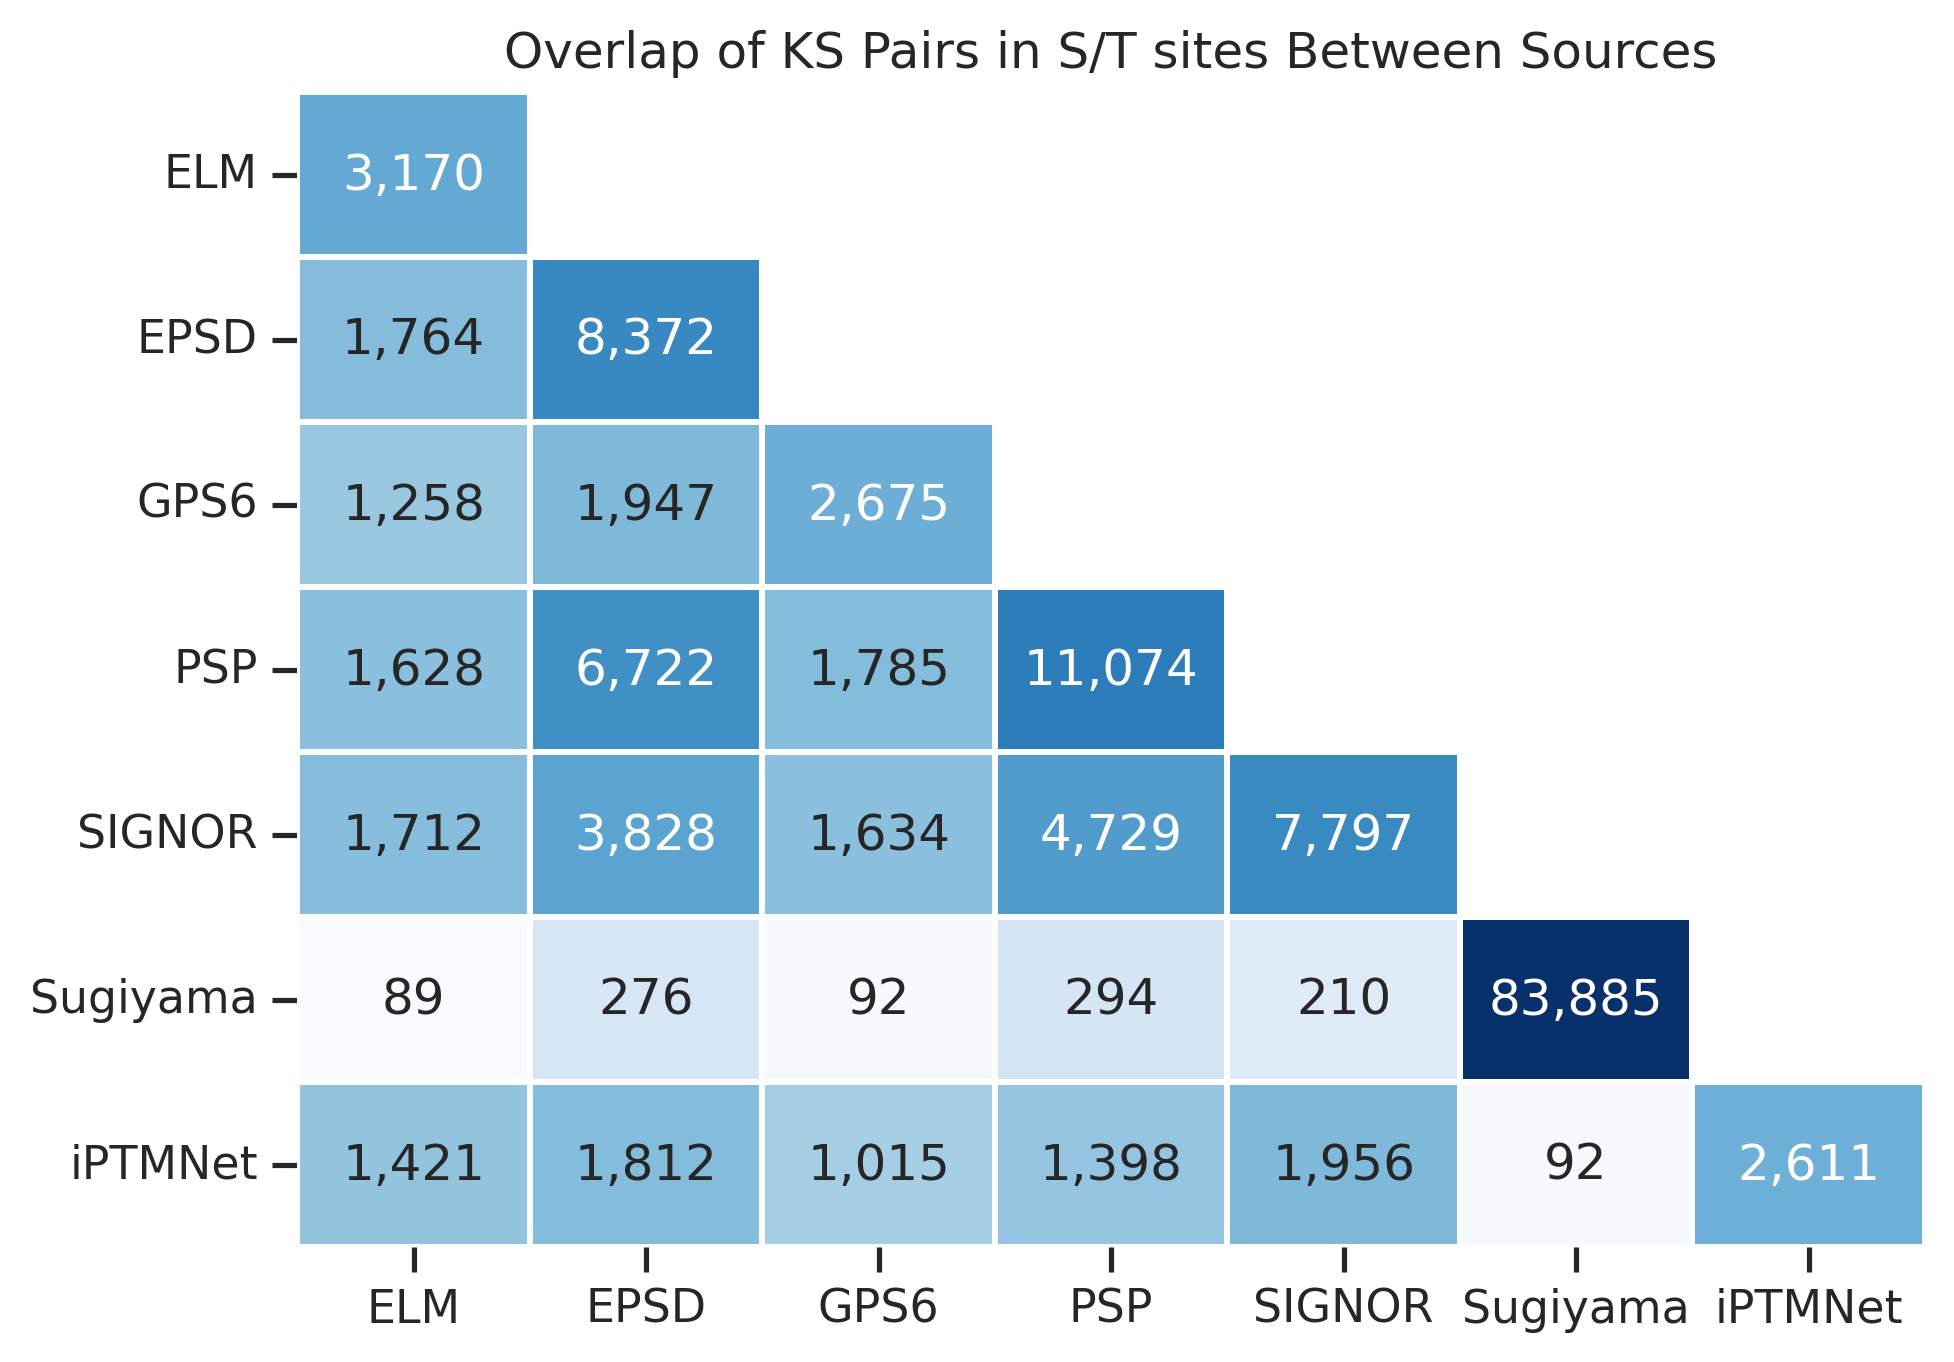
Overlap of phosphosites with human phosphoproteome
# data = Data.get_combine_site_phosphorylated()df=pd.read_parquet('raw/combine_source.parquet')
data = pd.read_parquet('raw/human_phosphoproteome.parquet')data = data.rename(columns={'uniprot':'substrate_uniprot'})def get_key(df):
df = df.copy()
print('original shape:',df.shape)
df['sub_site']=df['substrate_uniprot']+'_'+df['site']
df = df.drop_duplicates(subset='sub_site')
print('after removing duplicates',df.shape)
return dfdata_site = get_key(data)
df_site=get_key(df)original shape: (119955, 11)
after removing duplicates (119955, 11)
original shape: (211672, 7)
after removing duplicates (29811, 8)data_site = data_site[['sub_site']].copy()
df_site = df_site[['sub_site']].copy()
data_site['source']='Human Phosphoprotome'
df_site['source']='KS Datasets'
df_concat = pd.concat([data_site,df_site],ignore_index=True)df_concat_group = df_concat.groupby('sub_site')['source'].agg(lambda x: '|'.join(x)).reset_index()df_concat_group.source.value_counts()source
Human Phosphoprotome 102032
Human Phosphoprotome|KS Datasets 17923
KS Datasets 11888
Name: count, dtype: int64# plot_overlap(df_concat,source_col='source',id_col='sub_site',figsize=(4,2),
# title="Overlap of Unique Substrate Sites Between Datasets")Venn diagram:
# pip install matplotlib_vennfrom matplotlib_venn import venn2
set_human = set(data_site['sub_site'])
set_ks = set(df_site['sub_site'])
plt.figure(figsize=(5,5))
venn = venn2([set_human, set_ks],
# set_labels=('Human Phosphoproteome', 'KS Datasets')
set_labels=('', '')
)
for label in venn.subset_labels:
if label: # Check if the label exists (not empty subset)
label.set_text(f"{int(label.get_text()):,}") # Add comma formatting
plt.gca().set_aspect(0.8)
plt.title("Overlap of Unique Substrate Sites Between Datasets")
plt.show()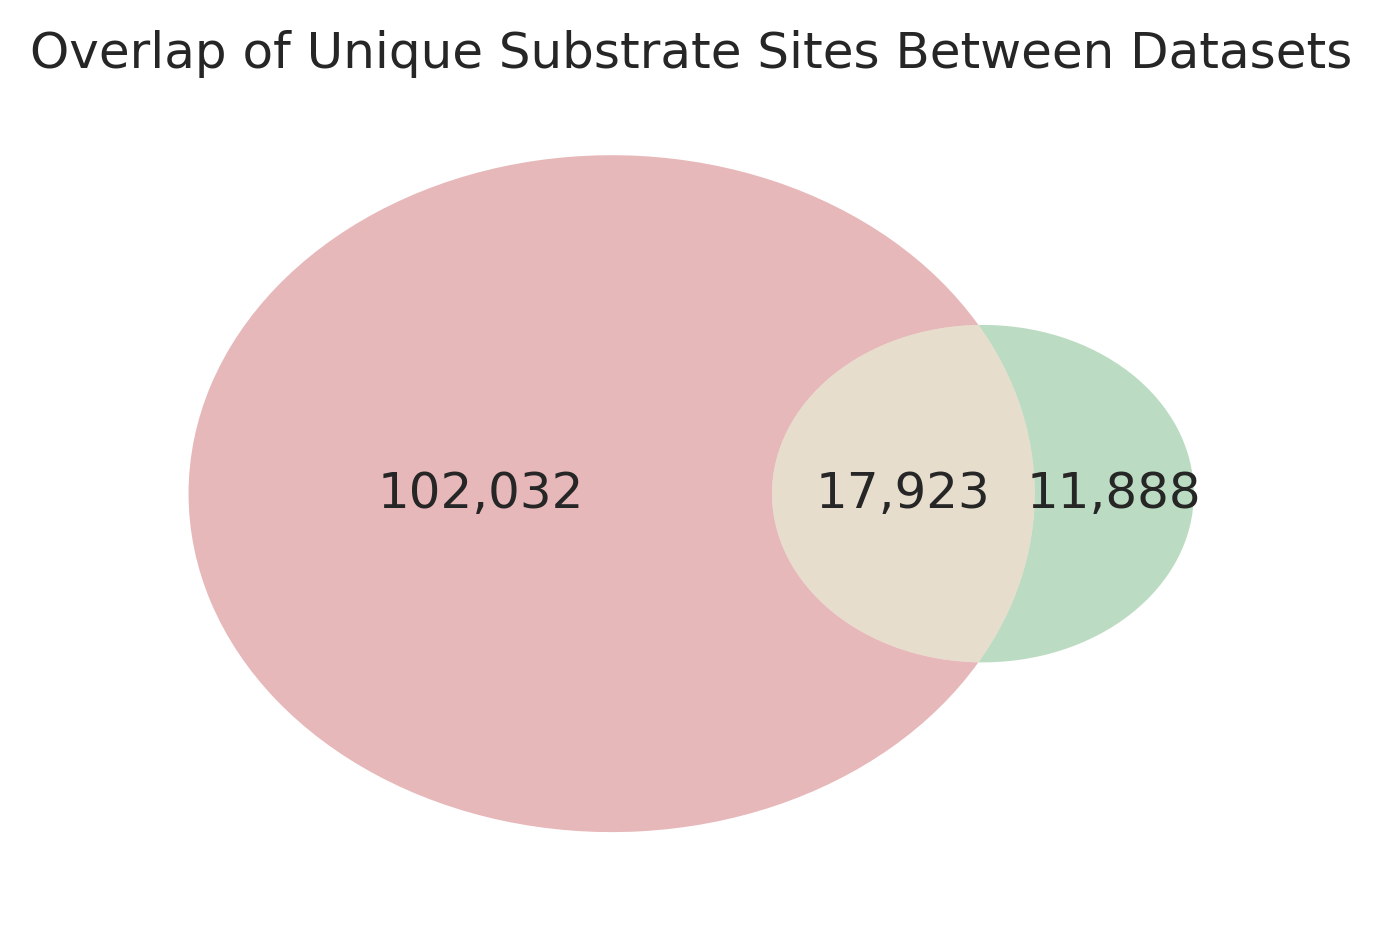
Stacked plot of S/T/Y compositions
df['acceptor']=df['site'].str[0]df_sugi = df[df.source=='Sugiyama'].reset_index(drop=True)
df_rest = df[df.source!='Sugiyama'].reset_index(drop=True)import matplotlib.ticker as mtickerdef plot_stacked(df,figsize=(6,4)):
plt.figure(figsize=figsize)
sns.histplot(data=df, x='source', hue='acceptor', multiple='stack', discrete=True, shrink=0.8)
plt.xlabel('')
plt.ylabel('Number of Sites')
plt.title('Total Number of Unique KS Pairs per Source')
plt.gca().yaxis.set_major_formatter(mticker.FuncFormatter(lambda x, _: f'{int(x):,}')) # show number with comma
plt.xticks(rotation=45)plot_stacked(df_rest)
def plot_stacked2(df,figsize=(6,4)):
    plt.figure(figsize=figsize)
    sns.histplot(data=df, x='source', hue='acceptor', multiple='stack', discrete=True, shrink=0.8)

    plt.xlabel('')
    plt.ylabel('')
    plt.xticks(rotation=45)
    plt.legend([],frameon=False)
    plt.gca().yaxis.set_major_formatter(mticker.FuncFormatter(lambda x, _: f'{int(x):,}'))
    plt.tick_params(axis='y', labelright=True, labelleft=False, right=True, left=False)
Uncomment below to plot the sugiyama site number:
# plot_stacked2(df_sugi,(0.7,4))Recovery rate
Check raw/recovery_rate.xlsx for more info.
The data is collected by: - Filter only human first, get dataframe shape - After kinase & substrate mapping, get the shape - After sites validation, get the shape
Co-occured kinase
df_group['substrate_uniprot_site']=df_group['substrate_uniprot']+'_'+df_group['site']from itertools import combinations
from collections import Counterdf_group.groupby('substrate_uniprot_site')['kinase_uniprot'].apply(list)substrate_uniprot_site
A0A2R8Y4L2_S158 [P48730]
A0A2R8Y4L2_S22 [O14757, O95819, Q13557]
A0A2R8Y4L2_S6 [O15264, P06493, Q9NR20]
A0A2R8Y4L2_S95 [O00238, O14920, O15075, O43318, O75676, O94806, O96017, P05771-2, P05771, P15735, P17252, P23443, P24723, P24941, P36507, P36896, P36897, P41743, P42679, P49137, P49759, P49761, P50750, P51812, P51955, P51957, P52333, P57059, P78362, P80192, Q02156, Q02779, Q04759, Q04771, Q05513, Q06187, Q13131, Q13554, Q13555, Q13557, Q14012, Q14680, Q15139, Q15349, Q16512, Q16513, Q16566, Q16584, Q16644, Q16816, Q86UE8, Q8IU85, Q8IW41, Q8N568, Q8TD19, Q8TDX7, Q96GD4, Q9BYT3, Q9BZL6, Q9NYL2, Q9UKI8, Q9UPE1, Q9UQM7, Q9Y2U5, Q9Y4K4]
A0A2R8Y4L2_T25 [O14757, O95819, Q13557]
...
Q9Y6Y8_S894 [Q96PF2, Q9BXA7]
Q9Y6Y8_T893 [P27448, Q7KZI7, Q96L34, Q9P0L2]
Q9Y6Y8_Y935 [P43405, P52333]
Q9Y6Y9_Y131 [P07948]
Q9Y6Y9_Y22 [P07948]
Name: kinase_uniprot, Length: 29811, dtype: object# Count co-occurring kinase pairs
co_occurrence = Counter()
for kinases in grouped:
for pair in combinations(sorted(set(kinases)), 2): # remove duplicates and sort for consistency
co_occurrence[pair] += 1
# print(co_occurrence)kinases = set()
for pair in co_occurrence.keys():
kinases.update(pair)
kinases = sorted(kinases)
# Initialize the co-occurrence matrix with zeros
matrix = pd.DataFrame(0, index=kinases, columns=kinases)
# Fill in the counts (matrix is symmetric)
for (k1, k2), count in co_occurrence.items():
matrix.loc[k1, k2] = count
matrix.loc[k2, k1] = countmatrix['P00533'].sort_values()P31152 0
Q16659 0
Q16654 0
P37173 0
P35790 0
...
P36888 478
P11362 480
P07949 480
P06213 481
Q15303 497
Name: P00533, Length: 433, dtype: int64counts = df_group.groupby('kinase_uniprot').agg({'substrate_uniprot_site':'size'})Jaccard
counts_series = counts['substrate_uniprot_site']

# Create a copy for normalized values
norm_matrix = matrix.copy().astype(float)

for k1 in matrix.index:
    for k2 in matrix.columns:
        intersection = matrix.loc[k1, k2]
        union = counts_series[k1] + counts_series[k2] - intersection
        norm_matrix.loc[k1, k2] = intersection / union if union != 0 else 0
    norm_matrix.loc[k1, k1] = 1 # diaganol to be 1
# Create a boolean mask for the upper triangle (k=1 excludes the diagonal)
mask = np.triu(np.ones(norm_matrix.shape), k=1).astype(bool)
norm_matrix = norm_matrix.where(mask)matrix['P00533'].sort_values(ascending=False).head()Q15303 497
P06213 481
P07949 480
P11362 480
P36888 478
Name: P00533, dtype: int64norm_matrix['P00533'].sort_values(ascending=False).head()O60674 0.253078
O15146 0.213529
P00519 0.203051
O43318 0.122415
O75676 0.023234
Name: P00533, dtype: float64kin_info = Data.get_kinase_info()st=kin_info[kin_info.group!='TK'].uniprot.tolist()st_col =norm_matrix.columns[norm_matrix.columns.isin(st)]st_matrix = norm_matrix[st_col]def get_max_jaccard(matrix):
a = matrix.max()
b = matrix.idxmax()
matrix = pd.concat([a, b], axis=1)
matrix.columns = ['jaccard', 'kinase_uniprot']
return matrix.sort_values('jaccard', ascending=False)get_max_jaccard(st_matrix)/tmp/ipykernel_169440/3714721923.py:3: FutureWarning: The behavior of DataFrame.idxmax with all-NA values, or any-NA and skipna=False, is deprecated. In a future version this will raise ValueError
b = matrix.idxmax()| jaccard | kinase_uniprot | |
|---|---|---|
| Q9NYV4 | 0.509804 | Q14004 |
| Q96QP1 | 0.500000 | Q96L96 |
| Q9Y6E0 | 0.465691 | Q9P289 |
| P28482 | 0.450737 | P27361 |
| P31751 | 0.437574 | P31749 |
| ... | ... | ... |
| O76039 | 0.000000 | O00141 |
| Q2M2I8 | 0.000000 | O00141 |
| O60885 | 0.000000 | O00141 |
| O00311 | 0.000000 | O00141 |
| O00141 | NaN | NaN |
323 rows × 2 columns
tyr=kin_info[kin_info.group=='TK'].uniprot.tolist()
tyr_col =norm_matrix.columns[norm_matrix.columns.isin(tyr)]
tyr_matrix = norm_matrix[tyr_col]get_max_jaccard(tyr_matrix)| jaccard | kinase_uniprot | |
|---|---|---|
| P54762 | 0.554638 | P54760 |
| Q15375 | 0.539118 | P21709 |
| P54753 | 0.531496 | P29320 |
| Q06418 | 0.526057 | P54762 |
| P54760 | 0.521168 | P54753 |
| ... | ... | ... |
| P04626 | 0.046957 | O43318 |
| O15146 | 0.044005 | O00506 |
| Q6J9G0 | 0.016393 | O43293 |
| Q6ZMQ8 | 0.004348 | O96017 |
| Q8IWU2 | 0.003676 | Q13976 |
83 rows × 2 columns
kin_info_uniprot = pd.read_excel('raw/uniprot_human_keyword_kinase.xlsx')kin_map = kin_info_uniprot.set_index('Entry')['Entry Name'].str.split('_').str[0]names = norm_matrix.index.map(kin_map)todo: Use filter to only select kinase >30 counts
import numpy as np
import pandas as pd
import matplotlib.pyplot as plt
import seaborn as sns
from scipy.cluster.hierarchy import linkage, dendrogram
from sklearn.manifold import MDS
import networkx as nx

# Assuming norm_matrix is your pre-computed Jaccard similarity matrix

# ---------------------------
# 1. Clustering & Heatmap

# Alternatively, using hierarchical clustering with scipy:
# Z = linkage(norm_matrix, method='average')
# plt.figure(figsize=(10, 5))
# dendrogram(Z, labels=norm_matrix.index)
# plt.title("Hierarchical Clustering Dendrogram")
# plt.xlabel("Kinase")
# plt.ylabel("Distance")
# plt.show()

Z = linkage(norm_matrix, method='average')
plt.figure(figsize=(4,50))
dendrogram(Z,orientation='left',leaf_font_size=7,labels=names,color_threshold=1.3)
plt.title('Hierarchical Clustering Dendrogram')
plt.ylabel('Distance')
plt.show()
# 2. Network Analysis
# ---------------------------
# Build a graph from norm_matrix (using a threshold to filter weak links)
threshold = 0.2  # adjust threshold as needed
G = nx.Graph()
for i, kinase1 in enumerate(norm_matrix.index):
    for j, kinase2 in enumerate(norm_matrix.columns):
        if i < j and norm_matrix.loc[kinase1, kinase2] > threshold:
            G.add_edge(kinase1, kinase2, weight=norm_matrix.loc[kinase1, kinase2])

# Draw the network
plt.figure(figsize=(10, 10))
pos = nx.spring_layout(G, weight='weight')
nx.draw(G, pos, with_labels=True, node_size=500, font_size=8)
plt.title("Kinase Similarity Network")
plt.show()
Frequency of kinase
Instead of showing PSSM, we can show the neigboring kinase
Kinase count
df_group['substrate_uniprot_site']=df_group['substrate_uniprot']+df_group['site']counts = df_group.groupby('kinase_uniprot').agg({'substrate_uniprot_site':'size'}).reset_index()counts| kinase_uniprot | substrate_uniprot_site | |
|---|---|---|
| 0 | O00141 | 387 |
| 1 | O00238 | 356 |
| 2 | O00311 | 50 |
| 3 | O00329 | 6 |
| 4 | O00418 | 202 |
| ... | ... | ... |
| 450 | Q9Y572 | 10 |
| 451 | Q9Y5S2 | 109 |
| 452 | Q9Y6E0 | 846 |
| 453 | Q9Y6M4 | 224 |
| 454 | Q9Y6R4 | 15 |
455 rows × 2 columns
kin_info = pd.read_excel('raw/uniprot_human_keyword_kinase.xlsx')kin_info = kin_info.rename(columns={'Entry':'kinase_uniprot'})kin_info2 = Data.get_kinase_info()(kin_info2.in_ST_paper==1).sum()303(kin_info2.in_Tyr_paper==1).sum()93in_pspa=(kin_info2.in_ST_paper==1)|(kin_info2.in_Tyr_paper==1)kin_info2[in_pspa]| kinase | ID_coral | uniprot | ID_HGNC | group | family | subfamily_coral | subfamily | in_ST_paper | in_Tyr_paper | ... | cytosol | cytoskeleton | plasma membrane | mitochondrion | Golgi apparatus | endoplasmic reticulum | vesicle | centrosome | aggresome | main_location | |
|---|---|---|---|---|---|---|---|---|---|---|---|---|---|---|---|---|---|---|---|---|---|
| 0 | AAK1 | AAK1 | Q2M2I8 | AAK1 | Other | NAK | NaN | NAK | 1 | 0 | ... | NaN | NaN | NaN | NaN | NaN | NaN | NaN | NaN | NaN | NaN |
| 1 | ABL1 | ABL1 | P00519 | ABL1 | TK | Abl | NaN | Abl | 0 | 1 | ... | 6.0 | NaN | 4.0 | NaN | NaN | NaN | NaN | NaN | NaN | cytosol |
| 2 | ABL2 | ABL2 | P42684 | ABL2 | TK | Abl | NaN | Abl | 0 | 1 | ... | 4.0 | 6.0 | NaN | NaN | NaN | NaN | NaN | NaN | NaN | cytoskeleton |
| 3 | TNK2 | ACK | Q07912 | TNK2 | TK | Ack | NaN | Ack | 0 | 1 | ... | NaN | NaN | NaN | NaN | NaN | NaN | 8.0 | NaN | 2.0 | vesicle |
| 4 | ACVR2A | ACTR2 | P27037 | ACVR2A | TKL | STKR | STKR2 | STKR2 | 1 | 0 | ... | 5.0 | NaN | NaN | NaN | NaN | 5.0 | NaN | NaN | NaN | cytosol |
| ... | ... | ... | ... | ... | ... | ... | ... | ... | ... | ... | ... | ... | ... | ... | ... | ... | ... | ... | ... | ... | ... |
| 518 | YSK1 | YSK1 | O00506 | STK25 | STE | STE20 | YSK | YSK | 1 | 0 | ... | 6.0 | NaN | NaN | NaN | 4.0 | NaN | NaN | NaN | NaN | cytosol |
| 519 | ZAK | ZAK | Q9NYL2 | MAP3K20 | TKL | MLK | ZAK | ZAK | 1 | 0 | ... | 5.0 | NaN | NaN | NaN | NaN | NaN | NaN | NaN | NaN | nucleus |
| 520 | ZAP70 | ZAP70 | P43403 | ZAP70 | TK | Syk | NaN | Syk | 0 | 1 | ... | 5.0 | NaN | 2.0 | NaN | NaN | NaN | NaN | NaN | NaN | cytosol |
| 521 | EEF2K | eEF2K | O00418 | EEF2K | Atypical | Alpha | eEF2K | eEF2K | 1 | 0 | ... | 9.0 | NaN | 1.0 | NaN | NaN | NaN | NaN | NaN | NaN | cytosol |
| 522 | FAM20C | FAM20C | Q8IXL6 | FAM20C | Atypical | FAM20C | NaN | FAM20C | 1 | 0 | ... | 2.0 | NaN | NaN | NaN | 7.0 | 1.0 | NaN | NaN | NaN | Golgi apparatus |
392 rows × 30 columns
kin_info2[Index(['kinase', 'ID_coral', 'uniprot', 'ID_HGNC', 'group', 'family',
'subfamily_coral', 'subfamily', 'in_ST_paper', 'in_Tyr_paper',
'in_cddm', 'pseudo', 'pspa_category_small', 'pspa_category_big',
'cddm_big', 'cddm_small', 'length', 'human_uniprot_sequence',
'kinasecom_domain', 'nucleus', 'cytosol', 'cytoskeleton',
'plasma membrane', 'mitochondrion', 'Golgi apparatus',
'endoplasmic reticulum', 'vesicle', 'centrosome', 'aggresome',
'main_location'],
dtype='object')df_group[df_group.kinase_uniprot=='P07948-2']| kin_sub_site | kinase_uniprot | substrate_uniprot | site | source | substrate_genes | substrate_sequence | substrate_phosphoseq | substrate_uniprot_site | |
|---|---|---|---|---|---|---|---|---|---|
| 30312 | P07948-2_A0MZ66_Y24 | P07948-2 | A0MZ66 | Y24 | Sugiyama | SHTN1 KIAA1598 | MNSSDEEKQLQLITSLKEQAIGEYEDLRAENQKTKEKCDKIRQERD... | MNSSDEEKQLQLITSLKEQAIGEyEDLRAENQKTKEKCDKIRQERD... | A0MZ66Y24 |
| 30313 | P07948-2_A1L429_Y10 | P07948-2 | A1L429 | Y10 | Sugiyama | GAGE12B; GAGE12C; GAGE12D; GAGE12E | MSWRGRSTYYWPRPRRYVQPPEMIGPMRPEQFSDEVEPATPEEGEP... | MSWRGRsTyyWPRPRRYVQPPEMIGPMRPEQFSDEVEPATPEEGEP... | A1L429Y10 |
| 30314 | P07948-2_A1L429_Y9 | P07948-2 | A1L429 | Y9 | Sugiyama | GAGE12B; GAGE12C; GAGE12D; GAGE12E | MSWRGRSTYYWPRPRRYVQPPEMIGPMRPEQFSDEVEPATPEEGEP... | MSWRGRsTyyWPRPRRYVQPPEMIGPMRPEQFSDEVEPATPEEGEP... | A1L429Y9 |
| 30315 | P07948-2_A1X283_Y855 | P07948-2 | A1X283 | Y855 | Sugiyama | SH3PXD2B FAD49 KIAA1295 TKS4 | MPPRRSIVEVKVLDVQKRRVPNKHYVYIIRVTWSSGSTEAIYRRYS... | MPPRRSIVEVKVLDVQKRRVPNKHYVYIIRVTWSSGSTEAIYRRYS... | A1X283Y855 |
| 30316 | P07948-2_A5A3E0_S939 | P07948-2 | A5A3E0 | S939 | Sugiyama | POTEF A26C1B | MVVEVDSMPAASSVKKPFGLRSKMGKWCCRCFPCCRESGKSNVGTS... | MVVEVDSMPAASSVKKPFGLRSKMGKWCCRCFPCCRESGKSNVGTS... | A5A3E0S939 |
| ... | ... | ... | ... | ... | ... | ... | ... | ... | ... |
| 31872 | P07948-2_Q9Y5S9_Y54 | P07948-2 | Q9Y5S9 | Y54 | Sugiyama | RBM8A RBM8 HSPC114 MDS014 | MADVLDLHEAGGEDFAMDEDGDESIHKLKEKAKKRKGRGFGSEEGS... | MADVLDLHEAGGEDFAMDEDGDESIHKLKEKAKKRKGRGFGSEEGS... | Q9Y5S9Y54 |
| 31873 | P07948-2_Q9Y639_Y216 | P07948-2 | Q9Y639 | Y216 | Sugiyama | NPTN SDFR1 SDR1 | MSGSSLPSALALSLLLVSGSLLPGPGAAQNAGFVKSPMSETKLTGD... | MSGSSLPSALALSLLLVSGSLLPGPGAAQNAGFVKSPMSETKLTGD... | Q9Y639Y216 |
| 31874 | P07948-2_Q9Y639_Y220 | P07948-2 | Q9Y639 | Y220 | Sugiyama | NPTN SDFR1 SDR1 | MSGSSLPSALALSLLLVSGSLLPGPGAAQNAGFVKSPMSETKLTGD... | MSGSSLPSALALSLLLVSGSLLPGPGAAQNAGFVKSPMSETKLTGD... | Q9Y639Y220 |
| 31875 | P07948-2_Q9Y696_S245 | P07948-2 | Q9Y696 | S245 | Sugiyama | CLIC4 | MALSMPLNGLKEEDKEPLIELFVKAGSDGESIGNCPFSQRLFMILW... | MALSMPLNGLKEEDKEPLIELFVKAGsDGEsIGNCPFSQRLFMILW... | Q9Y696S245 |
| 31876 | P07948-2_Q9Y696_Y244 | P07948-2 | Q9Y696 | Y244 | Sugiyama | CLIC4 | MALSMPLNGLKEEDKEPLIELFVKAGSDGESIGNCPFSQRLFMILW... | MALSMPLNGLKEEDKEPLIELFVKAGsDGEsIGNCPFSQRLFMILW... | Q9Y696Y244 |
1565 rows × 9 columns
counts| kinase_uniprot | substrate_uniprot_site | |
|---|---|---|
| 0 | O00141 | 387 |
| 1 | O00238 | 356 |
| 2 | O00311 | 50 |
| 3 | O00329 | 6 |
| 4 | O00418 | 202 |
| ... | ... | ... |
| 450 | Q9Y572 | 10 |
| 451 | Q9Y5S2 | 109 |
| 452 | Q9Y6E0 | 846 |
| 453 | Q9Y6M4 | 224 |
| 454 | Q9Y6R4 | 15 |
455 rows × 2 columns
counts.merge(kin_info)| kinase_uniprot | substrate_uniprot_site | Entry Name | Protein names | Gene Names | uniprot_keyword_kinase | on_tree | Organism | Keywords | Sequence | |
|---|---|---|---|---|---|---|---|---|---|---|
| 0 | O00141 | 387 | SGK1_HUMAN | Serine/threonine-protein kinase Sgk1 (EC 2.7.1... | SGK1 SGK | 1 | 1 | Homo sapiens (Human) | 3D-structure;Alternative promoter usage;Altern... | MTVKTEAAKGTLTYSRMRGMVAILIAFMKQRRMGLNDFIQKIANNS... |
| 1 | O00238 | 356 | BMR1B_HUMAN | Bone morphogenetic protein receptor type-1B (B... | BMPR1B | 1 | 1 | Homo sapiens (Human) | 3D-structure;Alternative splicing;ATP-binding;... | MLLRSAGKLNVGTKKEDGESTAPTPRPKVLRCKCHHHCPEDSVNNI... |
| 2 | O00311 | 50 | CDC7_HUMAN | Cell division cycle 7-related protein kinase (... | CDC7 CDC7L1 | 1 | 1 | Homo sapiens (Human) | 3D-structure;Alternative splicing;ATP-binding;... | MEASLGIQMDEPMAFSPQRDRFQAEGSLKKNEQNFKLAGVKKDIEK... |
| 3 | O00329 | 6 | PK3CD_HUMAN | Phosphatidylinositol 4,5-bisphosphate 3-kinase... | PIK3CD | 1 | 0 | Homo sapiens (Human) | 3D-structure;Adaptive immunity;Alternative spl... | MPPGVDCPMEFWTKEENQSVVVDFLLPTGVYLNFPVSRNANLSTIK... |
| 4 | O00418 | 202 | EF2K_HUMAN | Eukaryotic elongation factor 2 kinase (eEF-2 k... | EEF2K | 1 | 1 | Homo sapiens (Human) | 3D-structure;Acetylation;ATP-binding;Calcium;C... | MADEDLIFRLEGVDGGQSPRAGHDGDSDGDSDDEEGYFICPITDDP... |
| ... | ... | ... | ... | ... | ... | ... | ... | ... | ... | ... |
| 447 | Q9Y572 | 10 | RIPK3_HUMAN | Receptor-interacting serine/threonine-protein ... | RIPK3 RIP3 | 1 | 1 | Homo sapiens (Human) | 3D-structure;Alternative splicing;Apoptosis;AT... | MSCVKLWPSGAPAPLVSIEELENQELVGKGGFGTVFRAQHRKWGYD... |
| 448 | Q9Y5S2 | 109 | MRCKB_HUMAN | Serine/threonine-protein kinase MRCK beta (EC ... | CDC42BPB KIAA1124 | 1 | 1 | Homo sapiens (Human) | 3D-structure;ATP-binding;Cell junction;Cell me... | MSAKVRLKKLEQLLLDGPWRNESALSVETLLDVLVCLYTECSHSAL... |
| 449 | Q9Y6E0 | 846 | STK24_HUMAN | Serine/threonine-protein kinase 24 (EC 2.7.11.... | STK24 MST3 STK3 | 1 | 1 | Homo sapiens (Human) | 3D-structure;Acetylation;Alternative splicing;... | MDSRAQLWGLALNKRRATLPHPGGSTNLKADPEELFTKLEKIGKGS... |
| 450 | Q9Y6M4 | 224 | KC1G3_HUMAN | Casein kinase I isoform gamma-3 (CKI-gamma 3) ... | CSNK1G3 | 1 | 1 | Homo sapiens (Human) | 3D-structure;Acetylation;Alternative splicing;... | MENKKKDKDKSDDRMARPSGRSGHNTRGTGSSSSGVLMVGPNFRVG... |
| 451 | Q9Y6R4 | 15 | M3K4_HUMAN | Mitogen-activated protein kinase kinase kinase... | MAP3K4 KIAA0213 MAPKKK4 MEKK4 MTK1 | 1 | 1 | Homo sapiens (Human) | Alternative splicing;ATP-binding;Cytoplasm;Kin... | MREAAAALVPPPAFAVTPAAAMEEPPPPPPPPPPPPEPETESEPEC... |
452 rows × 10 columns
Source confidence
df_group.source.str.split('|').str.len().value_counts()source
1 174536
2 6123
3 3352
4 1312
5 923
6 770
7 50
Name: count, dtype: int64Self-phosphorylate
df_group[df_group['kinase_uniprot']==df_group['substrate_uniprot']].substrate_genes.value_counts().head(20)substrate_genes
LRRK2 PARK8 57
TRPM7 CHAK1 LTRPC7 46
MARK2 EMK1 35
BMX 34
TTK MPS1 MPS1L1 34
NEK4 STK2 33
DCLK2 DCAMKL2 DCDC3B DCK2 32
ERBB4 HER4 32
ABL1 ABL JTK7 32
MARK1 KIAA1477 MARK 31
HIPK2 31
RPS6KA2 MAPKAPK1C RSK3 29
BTK AGMX1 ATK BPK 29
STK4 KRS2 MST1 28
BUB1B BUBR1 MAD3L SSK1 28
PDGFRA PDGFR2 RHEPDGFRA 28
ITK EMT LYK 28
RPS6KA6 RSK4 28
PRKD2 PKD2 HSPC187 28
ABL2 ABLL ARG 27
Name: count, dtype: int64df_group.sourcesource
Sugiyama 167633
EPSD|PSP 3346
PSP 2932
SIGNOR 1984
SIGNOR|EPSD|PSP 1878
...
GPS6|SIGNOR|ELM|Sugiyama 1
ELM|iPTMNet|Sugiyama 1
ELM|iPTMNet|EPSD|Sugiyama 1
iPTMNet|PSP|Sugiyama 1
SIGNOR|ELM|EPSD|Sugiyama 1
Name: count, Length: 111, dtype: int64