Collecting gseapy
  Downloading gseapy-1.1.7.tar.gz (112 kB)
     ━━━━━━━━━━━━━━━━━━━━━━━━━━━━━━━━━━━━━━━ 112.5/112.5 kB 8.3 MB/s eta 0:00:00
  Installing build dependencies ... done
  Getting requirements to build wheel ... done
  Preparing metadata (pyproject.toml) ... done
Requirement already satisfied: numpy>=1.13.0 in /system/conda/miniconda3/envs/cloudspace/lib/python3.10/site-packages (from gseapy) (1.26.2)
Requirement already satisfied: scipy in /system/conda/miniconda3/envs/cloudspace/lib/python3.10/site-packages (from gseapy) (1.11.4)
Requirement already satisfied: pandas in /system/conda/miniconda3/envs/cloudspace/lib/python3.10/site-packages (from gseapy) (2.1.4)
Requirement already satisfied: matplotlib>=2.2 in /system/conda/miniconda3/envs/cloudspace/lib/python3.10/site-packages (from gseapy) (3.8.2)
Requirement already satisfied: requests in /system/conda/miniconda3/envs/cloudspace/lib/python3.10/site-packages (from gseapy) (2.32.3)
Requirement already satisfied: contourpy>=1.0.1 in /system/conda/miniconda3/envs/cloudspace/lib/python3.10/site-packages (from matplotlib>=2.2->gseapy) (1.2.1)
Requirement already satisfied: cycler>=0.10 in /system/conda/miniconda3/envs/cloudspace/lib/python3.10/site-packages (from matplotlib>=2.2->gseapy) (0.12.1)
Requirement already satisfied: fonttools>=4.22.0 in /system/conda/miniconda3/envs/cloudspace/lib/python3.10/site-packages (from matplotlib>=2.2->gseapy) (4.53.0)
Requirement already satisfied: kiwisolver>=1.3.1 in /system/conda/miniconda3/envs/cloudspace/lib/python3.10/site-packages (from matplotlib>=2.2->gseapy) (1.4.5)
Requirement already satisfied: packaging>=20.0 in /system/conda/miniconda3/envs/cloudspace/lib/python3.10/site-packages (from matplotlib>=2.2->gseapy) (24.0)
Requirement already satisfied: pillow>=8 in /system/conda/miniconda3/envs/cloudspace/lib/python3.10/site-packages (from matplotlib>=2.2->gseapy) (10.3.0)
Requirement already satisfied: pyparsing>=2.3.1 in /system/conda/miniconda3/envs/cloudspace/lib/python3.10/site-packages (from matplotlib>=2.2->gseapy) (3.1.2)
Requirement already satisfied: python-dateutil>=2.7 in /system/conda/miniconda3/envs/cloudspace/lib/python3.10/site-packages (from matplotlib>=2.2->gseapy) (2.9.0.post0)
Requirement already satisfied: pytz>=2020.1 in /system/conda/miniconda3/envs/cloudspace/lib/python3.10/site-packages (from pandas->gseapy) (2024.1)
Requirement already satisfied: tzdata>=2022.1 in /system/conda/miniconda3/envs/cloudspace/lib/python3.10/site-packages (from pandas->gseapy) (2024.1)
Requirement already satisfied: charset-normalizer<4,>=2 in /system/conda/miniconda3/envs/cloudspace/lib/python3.10/site-packages (from requests->gseapy) (3.3.2)
Requirement already satisfied: idna<4,>=2.5 in /system/conda/miniconda3/envs/cloudspace/lib/python3.10/site-packages (from requests->gseapy) (3.7)
Requirement already satisfied: urllib3<3,>=1.21.1 in /system/conda/miniconda3/envs/cloudspace/lib/python3.10/site-packages (from requests->gseapy) (2.2.1)
Requirement already satisfied: certifi>=2017.4.17 in /system/conda/miniconda3/envs/cloudspace/lib/python3.10/site-packages (from requests->gseapy) (2024.6.2)
Requirement already satisfied: six>=1.5 in /system/conda/miniconda3/envs/cloudspace/lib/python3.10/site-packages (from python-dateutil>=2.7->matplotlib>=2.2->gseapy) (1.16.0)
Building wheels for collected packages: gseapy
  Building wheel for gseapy (pyproject.toml) ... error
  error: subprocess-exited-with-error

  × Building wheel for gseapy (pyproject.toml) did not run successfully.
  │ exit code: 1
  ╰─> [47 lines of output]
      <string>:10: SetuptoolsDeprecationWarning: The test command is disabled and references to it are deprecated.
      !!

              ********************************************************************************
              Please remove any references to `setuptools.command.test` in all supported versions of the affected package.

              This deprecation is overdue, please update your project and remove deprecated
              calls to avoid build errors in the future.
              ********************************************************************************

      !!
      /tmp/pip-build-env-_ofns4hr/overlay/lib/python3.10/site-packages/setuptools/_distutils/dist.py:289: UserWarning: Unknown distribution option: 'tests_require'
        warnings.warn(msg)
      running bdist_wheel
      running build
      running build_py
      creating build/lib.linux-x86_64-cpython-310/gseapy
      copying gseapy/gsea.py -> build/lib.linux-x86_64-cpython-310/gseapy
      copying gseapy/msigdb.py -> build/lib.linux-x86_64-cpython-310/gseapy
      copying gseapy/base.py -> build/lib.linux-x86_64-cpython-310/gseapy
      copying gseapy/__init__.py -> build/lib.linux-x86_64-cpython-310/gseapy
      copying gseapy/ssgsea.py -> build/lib.linux-x86_64-cpython-310/gseapy
      copying gseapy/plot.py -> build/lib.linux-x86_64-cpython-310/gseapy
      copying gseapy/stats.py -> build/lib.linux-x86_64-cpython-310/gseapy
      copying gseapy/gsva.py -> build/lib.linux-x86_64-cpython-310/gseapy
      copying gseapy/biomart.py -> build/lib.linux-x86_64-cpython-310/gseapy
      copying gseapy/__main__.py -> build/lib.linux-x86_64-cpython-310/gseapy
      copying gseapy/parser.py -> build/lib.linux-x86_64-cpython-310/gseapy
      copying gseapy/enrichr.py -> build/lib.linux-x86_64-cpython-310/gseapy
      copying gseapy/algorithm.py -> build/lib.linux-x86_64-cpython-310/gseapy
      copying gseapy/utils.py -> build/lib.linux-x86_64-cpython-310/gseapy
      copying gseapy/scipalette.py -> build/lib.linux-x86_64-cpython-310/gseapy
      creating build/lib.linux-x86_64-cpython-310/gseapy/data
      copying gseapy/data/palette.json -> build/lib.linux-x86_64-cpython-310/gseapy/data
      running build_ext
      running build_rust
      error: can't find Rust compiler

      If you are using an outdated pip version, it is possible a prebuilt wheel is available for this package but pip is not able to install from it. Installing from the wheel would avoid the need for a Rust compiler.

      To update pip, run:

          pip install --upgrade pip

      and then retry package installation.

      If you did intend to build this package from source, try installing a Rust compiler from your system package manager and ensure it is on the PATH during installation. Alternatively, rustup (available at https://rustup.rs) is the recommended way to download and update the Rust compiler toolchain.
      [end of output]

  note: This error originates from a subprocess, and is likely not a problem with pip.
  ERROR: Failed building wheel for gseapy
Failed to build gseapy
ERROR: Could not build wheels for gseapy, which is required to install pyproject.toml-based projects
Note: you may need to restart the kernel to use updated packages.
Collecting git+git://github.com/tanghaibao/goatools.git
  Cloning git://github.com/tanghaibao/goatools.git to /tmp/pip-req-build-g6i3ofg4
  Running command git clone --filter=blob:none --quiet git://github.com/tanghaibao/goatools.git /tmp/pip-req-build-g6i3ofg4
^C
ERROR: Operation cancelled by user
Note: you may need to restart the kernel to use updated packages.
import gseapy as gpimport pandas as pd# List of genes for analysisgene_list = ["TP53", "BRCA1", "EGFR", "MYC", "CDK1"] # Replace with your gene list# Perform GO Biological Process enrichment analysisenr = gp.enrichr(gene_list=gene_list, gene_sets="GO_Biological_Process_2021", # Use latest available GO BP dataset organism='human', # Change if using other species outdir=None) # Set an output directory if you want result files# Convert results to a Pandas DataFrameresults_df = enr.results# Filter for significant results (adjust as needed)significant_results = results_df[results_df['Adjusted P-value'] <0.05]# Display resultsimport ace_tools as toolstools.display_dataframe_to_user(name="GO Biological Process Enrichment Results", dataframe=significant_results)
---------------------------------------------------------------------------ModuleNotFoundError Traceback (most recent call last)
Cell In[2], line 1----> 1importgseapyasgp 2importpandasaspd 4# List of genes for analysisModuleNotFoundError: No module named 'gseapy'
Setup
!pip install reactome2py
from reactome2py import analysisfrom matplotlib import pyplot as pltfrom pandas import json_normalizeimport os, pandas as pd, numpy as np, seaborn as snsfrom tqdm import tqdmfrom PIL import Image
Utils
def get_reactome_raw(gene_list):"Reactome pathway analysis for a given gene set; returns raw output in dataframe." gene_str =','.join(gene_list)# set page size and page to -1 ensures to display all pathway results, sort by pvalue instead of fdr, projection set to True is consistent with official web result = analysis.identifiers(gene_str, page_size='-1', page='-1', sort_by='ENTITIES_PVALUE',projection=True) out = json_normalize(result['pathways'])return out
Example:
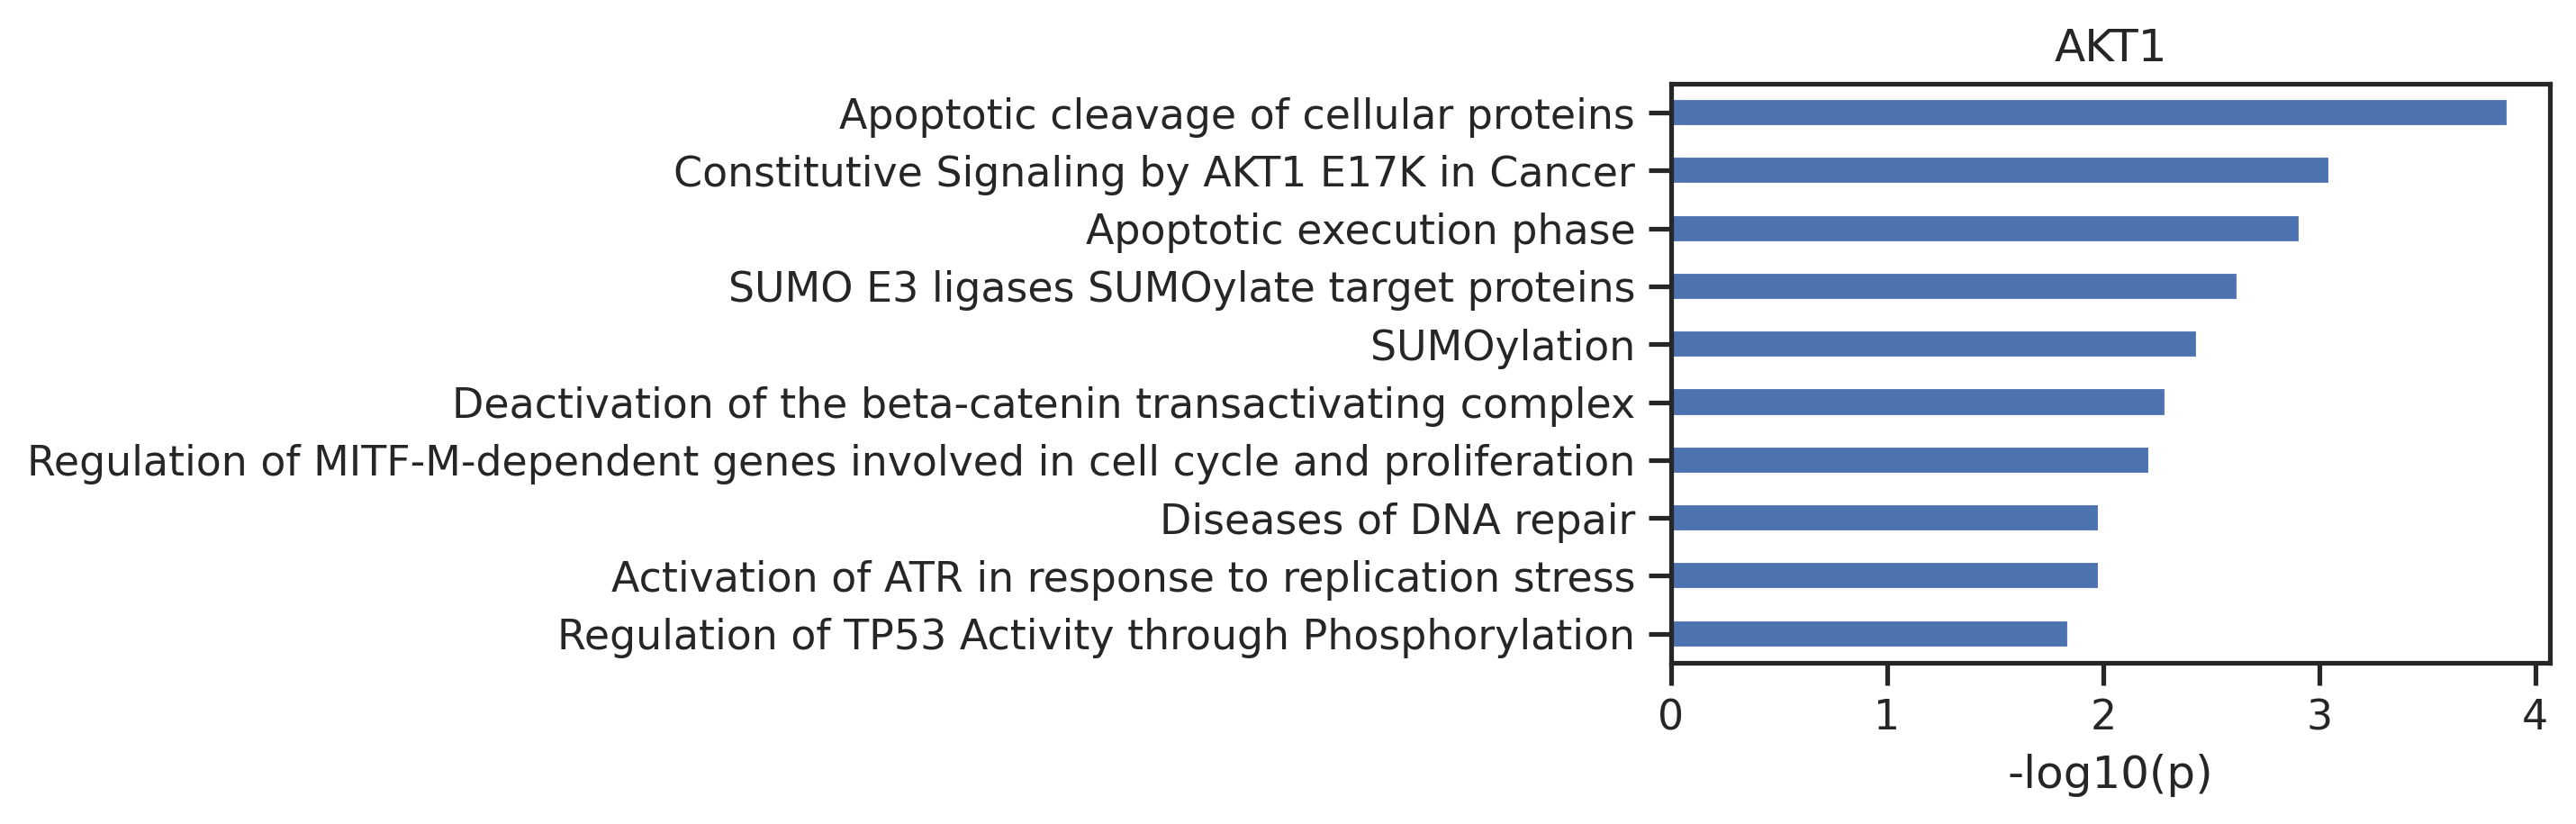
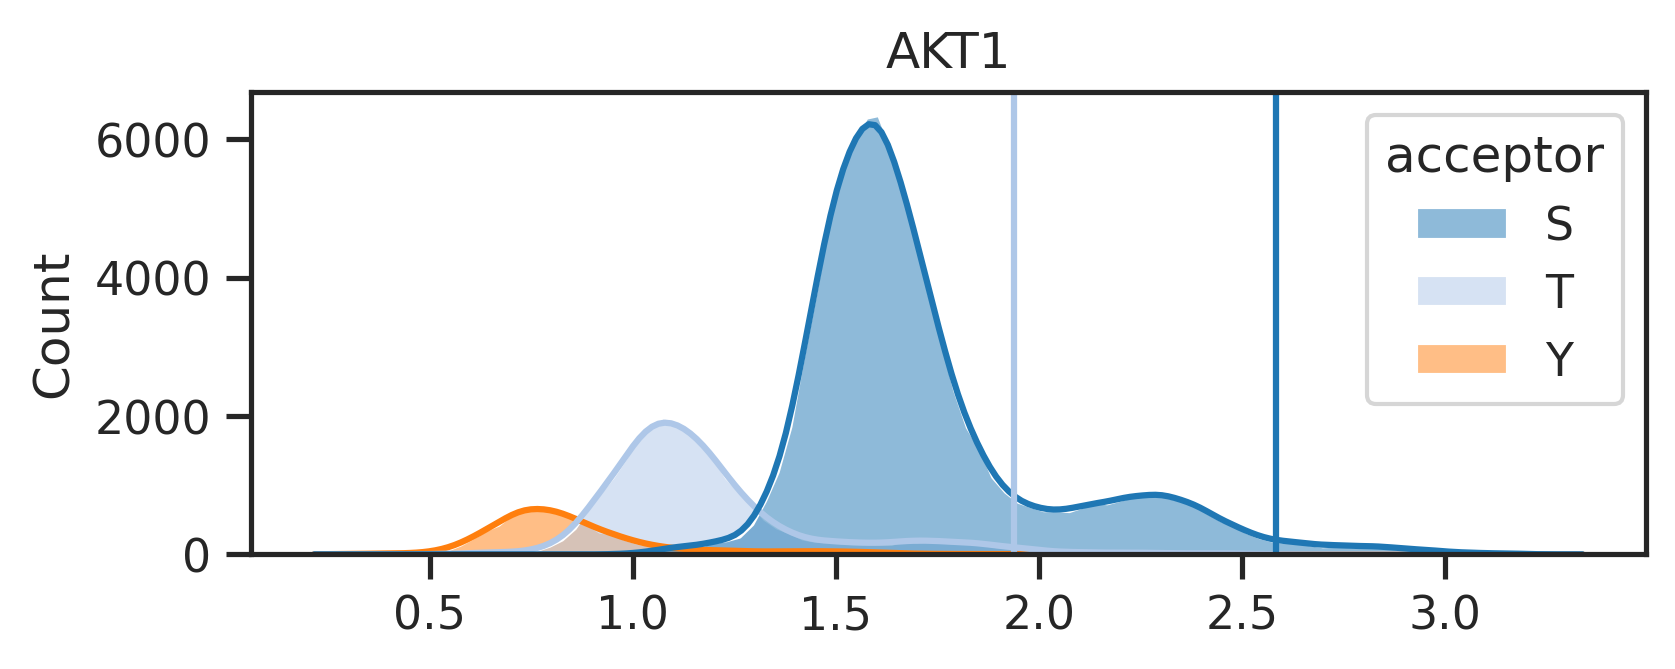
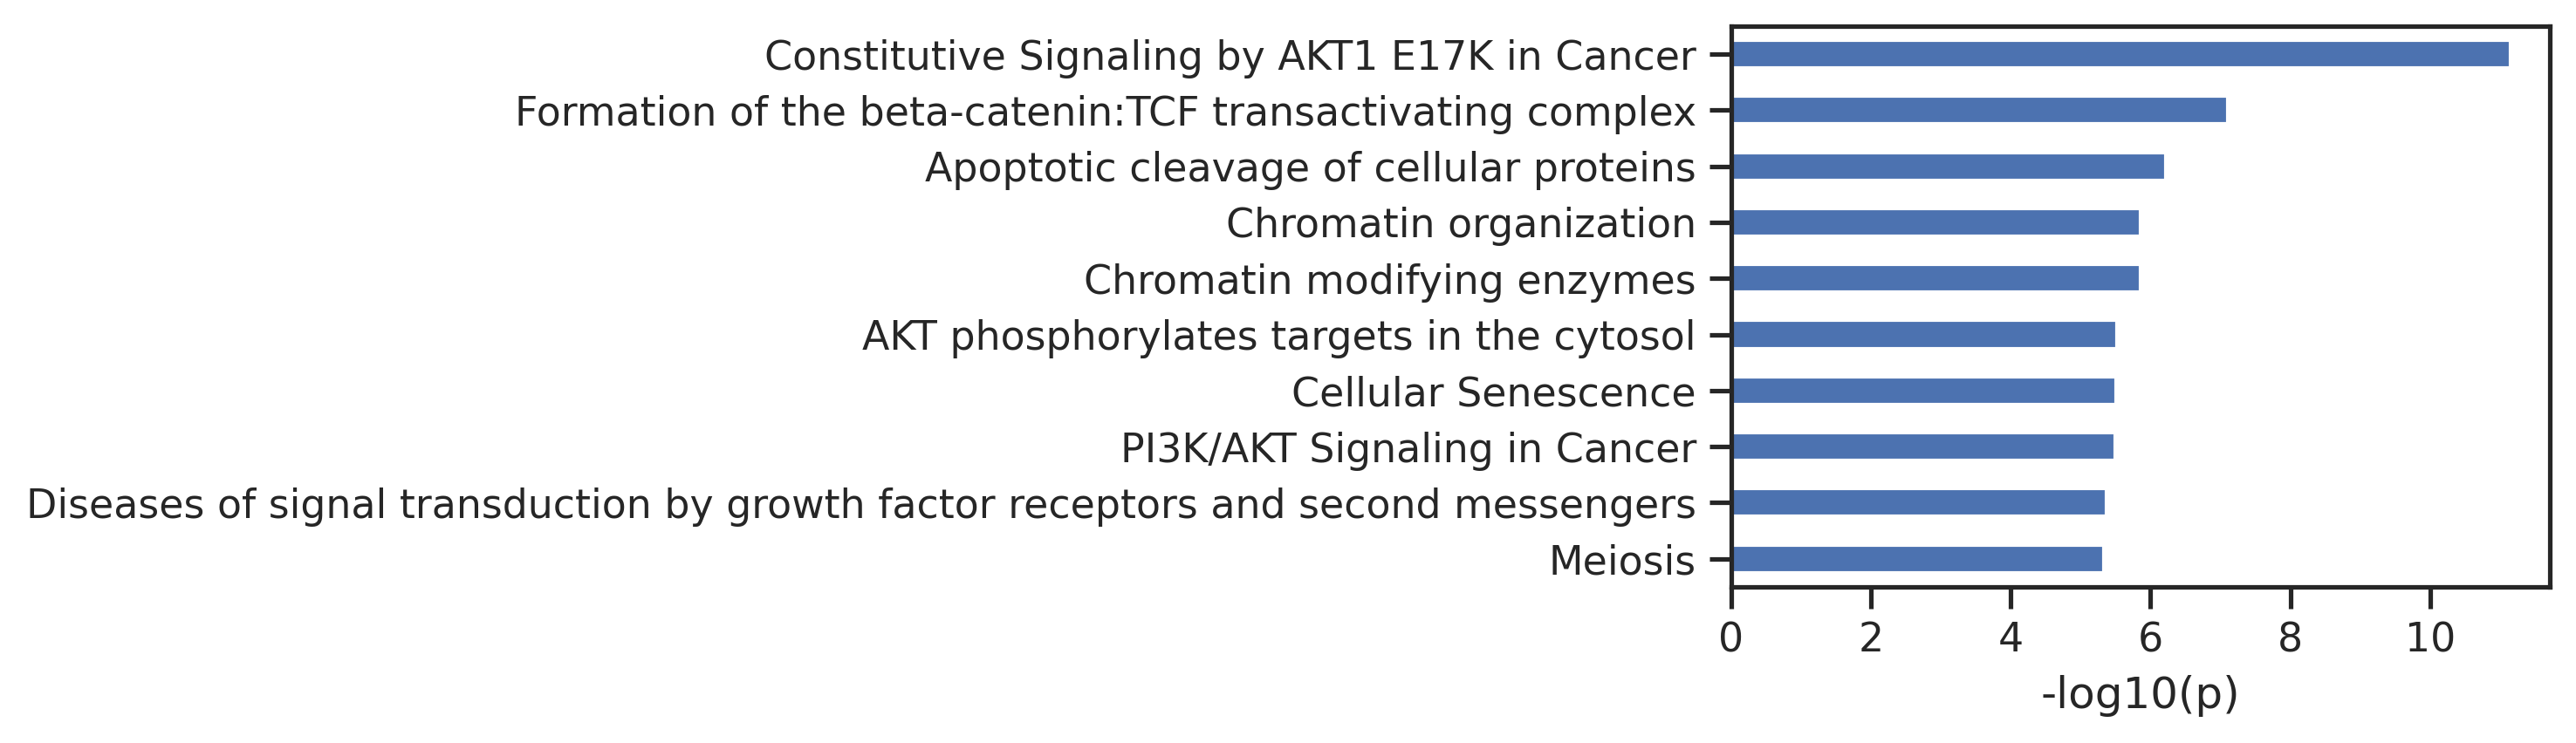
# get gene listgenes = pd.read_csv('raw/AKT1.csv')['gene'].tolist()get_reactome_raw(genes).head()
stId
dbId
name
llp
inDisease
species.dbId
species.taxId
species.name
entities.resource
entities.total
entities.found
entities.ratio
entities.pValue
entities.fdr
entities.exp
reactions.resource
reactions.total
reactions.found
reactions.ratio
0
R-HSA-111465
111465
Apoptotic cleavage of cellular proteins
True
False
48887
9606
Homo sapiens
TOTAL
38
33
0.002428
0.000134
0.322956
[]
TOTAL
38
38
0.002506
1
R-HSA-5674400
5674400
Constitutive Signaling by AKT1 E17K in Cancer
True
True
48887
9606
Homo sapiens
TOTAL
29
25
0.001853
0.000889
0.878858
[]
TOTAL
18
18
0.001187
2
R-HSA-75153
75153
Apoptotic execution phase
True
False
48887
9606
Homo sapiens
TOTAL
54
39
0.003450
0.001225
0.878858
[]
TOTAL
57
57
0.003759
3
R-HSA-3108232
3108232
SUMO E3 ligases SUMOylate target proteins
False
False
48887
9606
Homo sapiens
TOTAL
184
104
0.011755
0.002371
0.878858
[]
TOTAL
132
102
0.008705
4
R-HSA-2990846
2990846
SUMOylation
False
False
48887
9606
Homo sapiens
TOTAL
193
107
0.012330
0.003650
0.878858
[]
TOTAL
141
111
0.009298
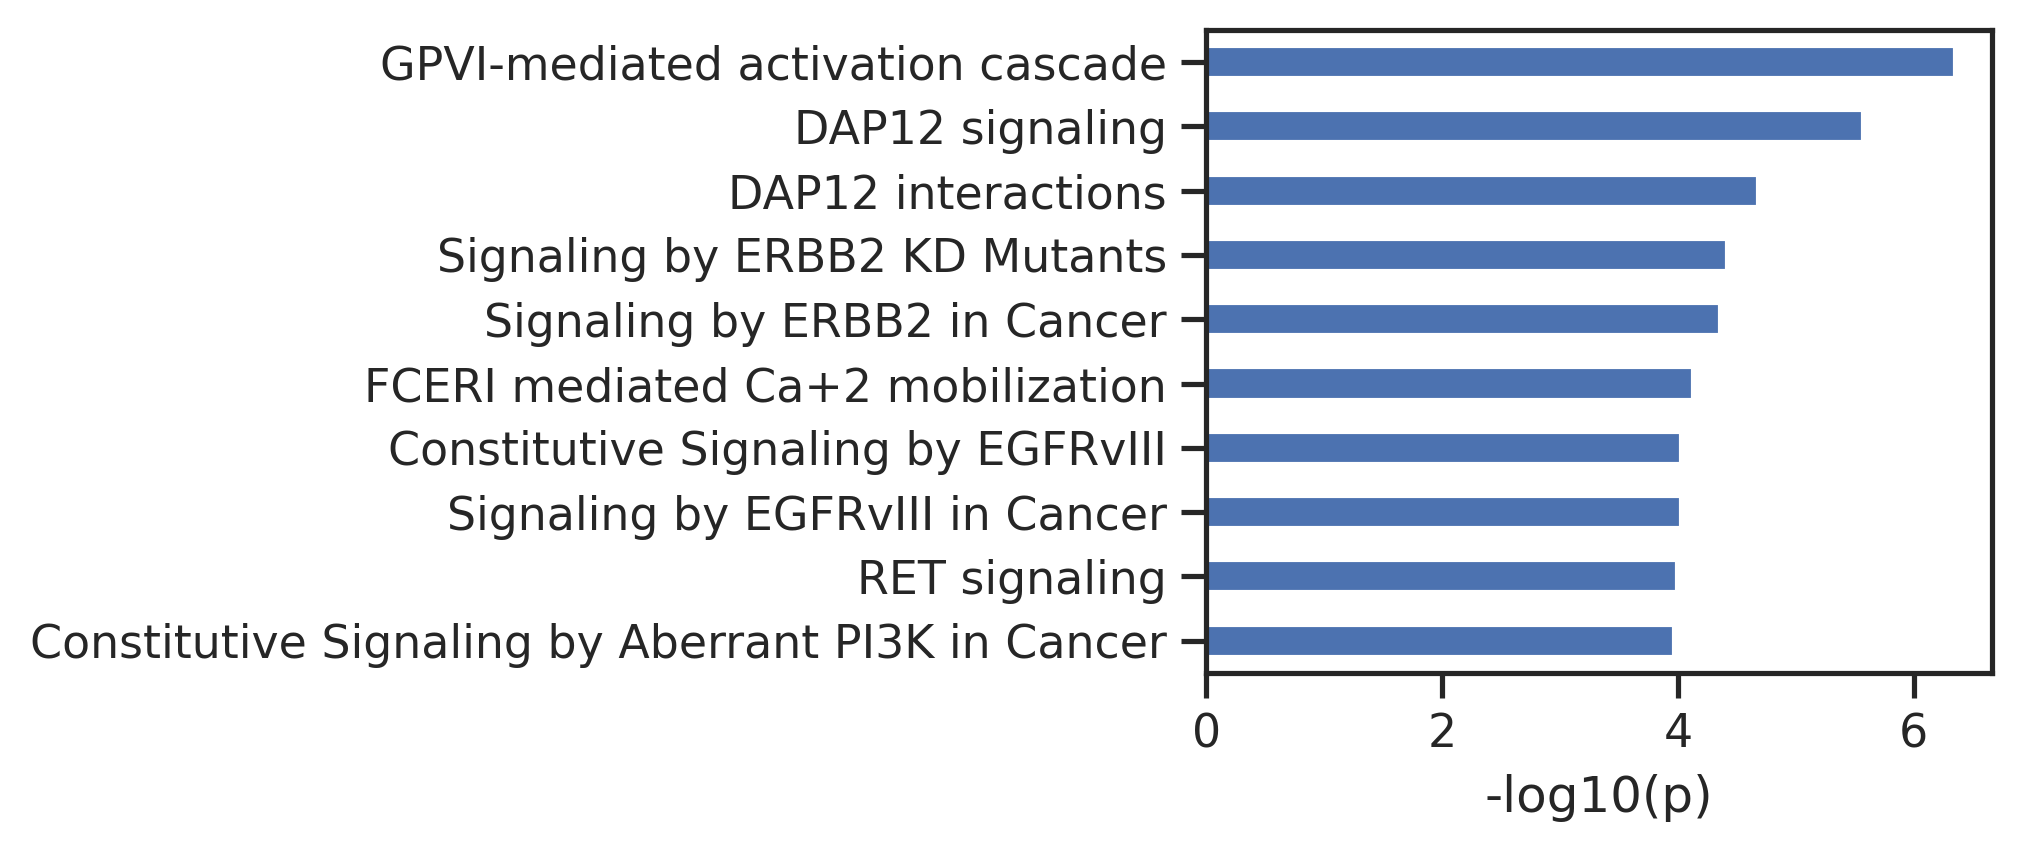
def plot_path(react_out, top_n=10,max_label_length=80):"Plot the output of get_reactome."# Extract the data and reverse it data = react_out.head(top_n).set_index('name')['-log10_pValue'].iloc[::-1]# Truncate labels if they are too long truncated_labels = [label[:max_label_length] +'...'iflen(label) > max_label_length else label for label in data.index] data.index = truncated_labels# Calculate the required width: base width + additional width for the longest label base_width =2 max_label_length =max(data.index, key=len) additional_width =len(max_label_length) *0.1# Adjust scaling factor as needed figsize = (base_width + additional_width, 3*top_n/10) # Adjust height as necessary# Plotting data.plot.barh(figsize=figsize) plt.ylabel('') plt.xlabel('-log10(p)') plt.tight_layout() # Adjust layout to fit everything
def get_reactome(gene_list, plot=True):"Given a gene list, get the processed output of reactome; output contains additional -log10(p)" out = get_reactome_raw(gene_list) out = out[['name','entities.pValue']].rename(columns={'entities.pValue':'pValue'}) out['-log10_pValue'] =-np.log10(out['pValue']).round(3)if plot: plot_pathreturn out
For the original human phosphoproteome (all-uppercase):
site= Data.get_combine_site_psp_ochoa()
For phosphorylated human phosphoproteome, uncheck below:
# site = Data.get_combine_site_phosphorylated()
For PSP site, uncheck below:
# site = Data.get_psp_human_site()# site['acceptor'] = site.site_seq.str[7]# # remove none sty-phosphoacceptor sequence# site = site['acceptor'].isin(['s','t','y'])]# # convert lowercase other than s,t,y to capital; convert rare aa to _# site['site_seq'] = site.site_seq.apply(convert_string)# site = site.reset_index(drop=True)# site.to_parquet('PSP_human_processed_sites.parquet')# site = pd.read_parquet('PSP_human_processed_sites.parquet')
As the original phosphoproteome is an all-uppercase dataset, we choose param to be param_CDDM_upper
param = param_CDDM_upper## for phosphorylated dataset, we will choose the standard param# param = param_CDDM## or# param = param_PSPA
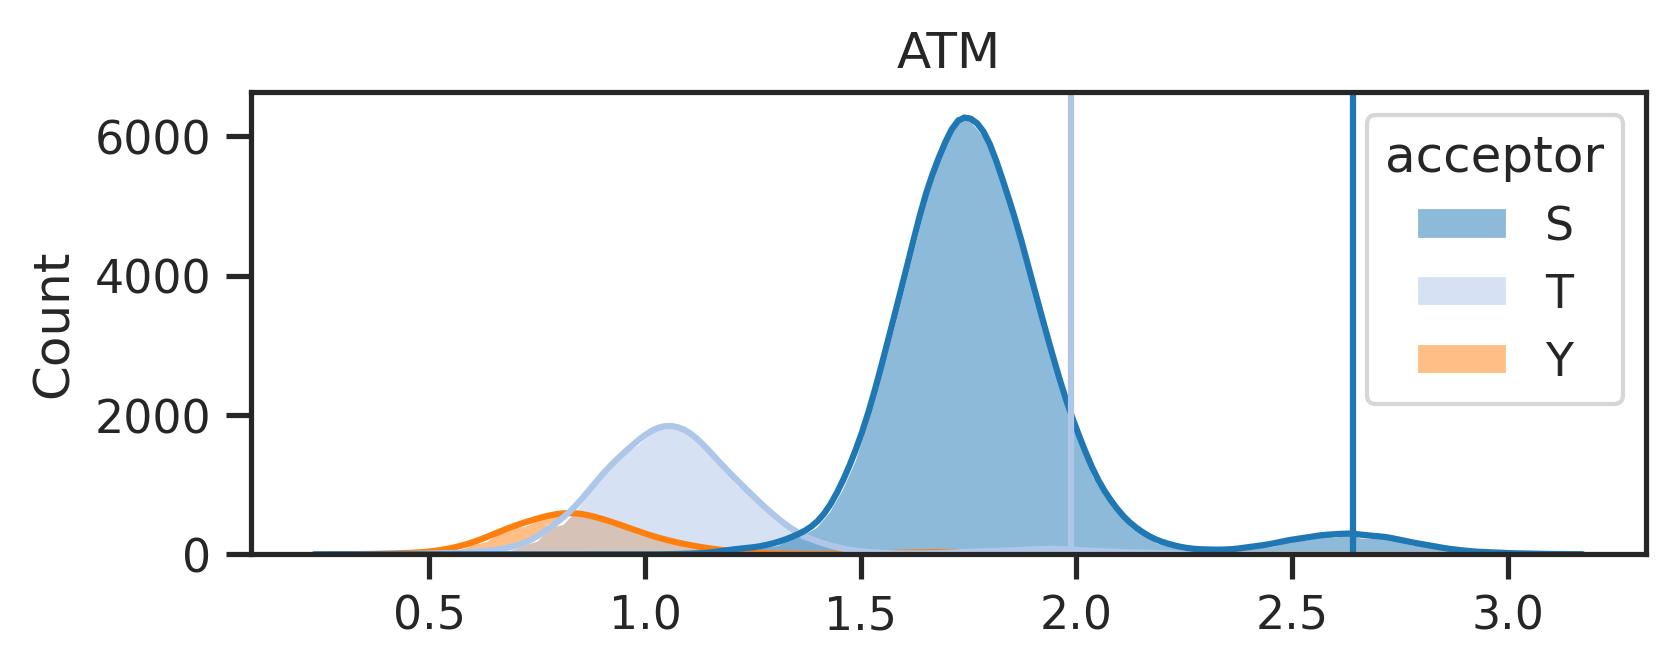
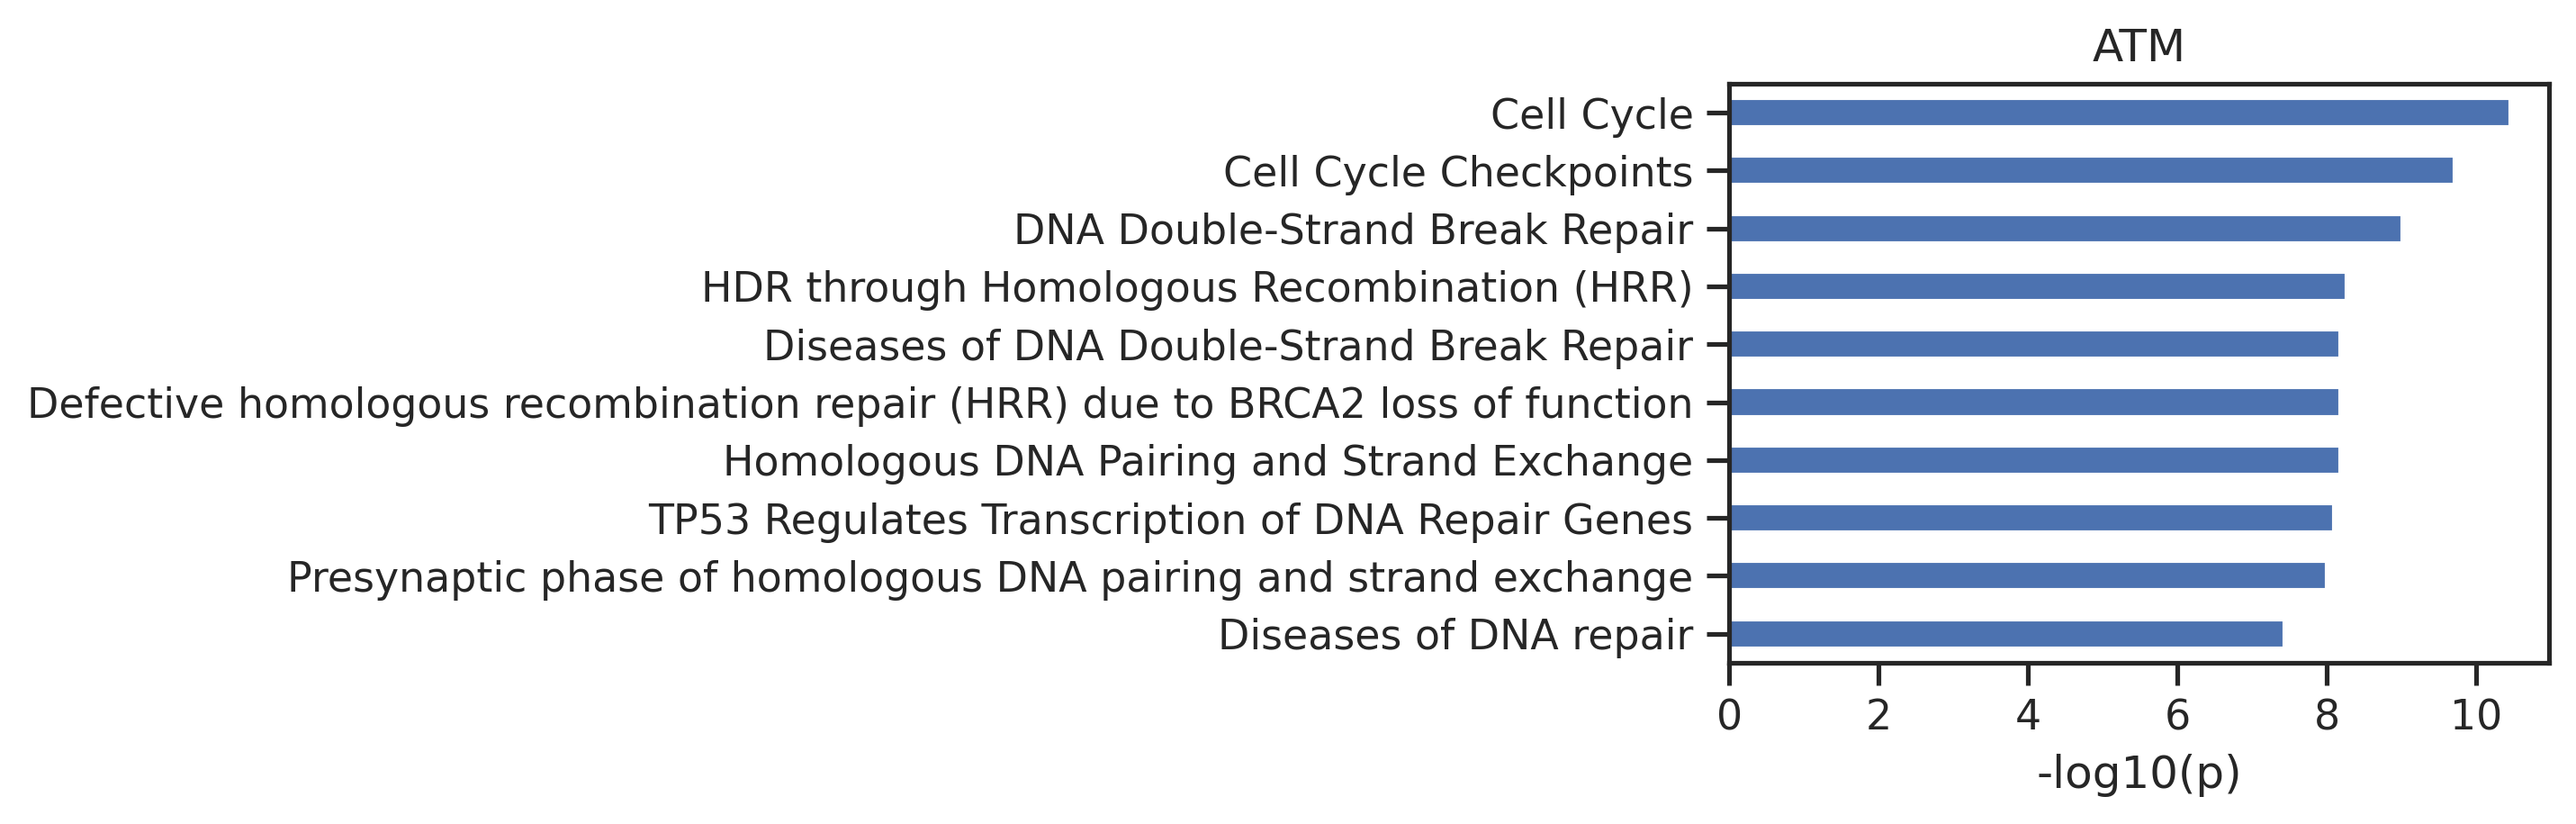
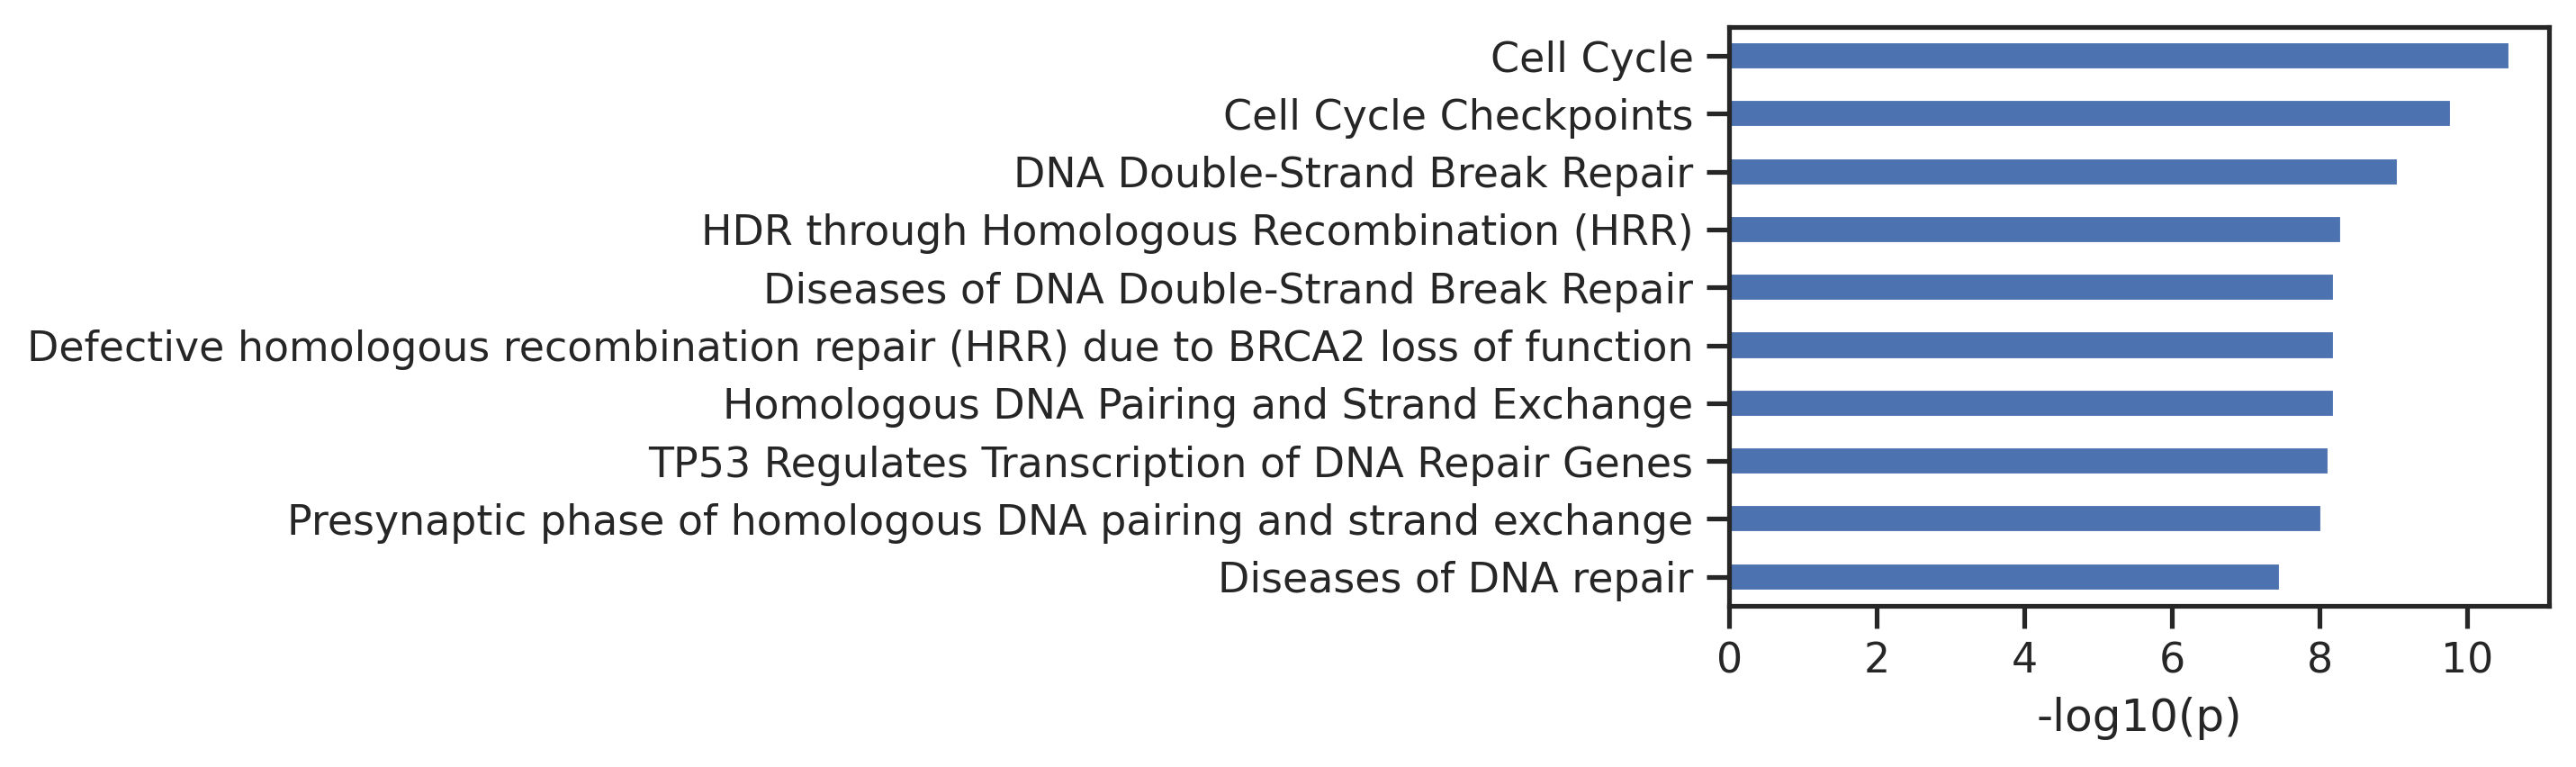
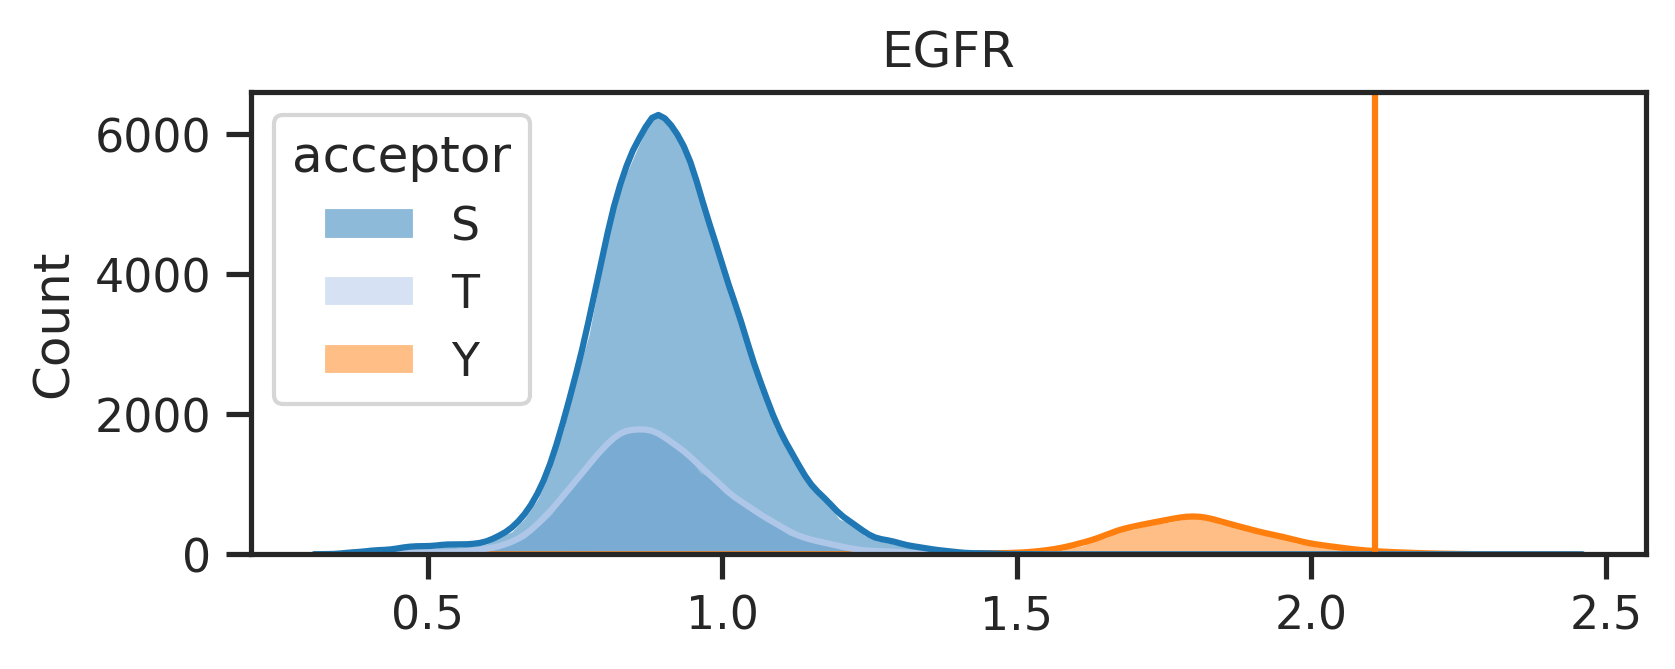
The above line will create two folders under the {save_folder}: - path_fig folder contains the pathway analysis. - score_distribute folder contains histogram of score distribution.
Combine images for pdf
def combine_images_vertically(image_paths, output_path):# Open images and convert them to 'RGBA' for uniformity images = [Image.open(image_path).convert('RGBA') for image_path in image_paths]# Calculate the total width as the maximum width of any image total_width =max(image.width for image in images)# Calculate the total height by summing the heights of all images total_height =sum(image.height for image in images)# set the background white board size# total_width, total_height = 2010,1200 total_width, total_height =3000,1750# Create a new image with a white background in 'RGBA' mode combined_image = Image.new('RGBA', (total_width, total_height), (255, 255, 255, 255))# Initialize the y_offset to start pasting images from the top y_offset =0for image in images:# Calculate the x position to center the image x_offset = (total_width - image.width) //2# Paste the current image into the combined image combined_image.paste(image, (x_offset, y_offset), image)# Update the y_offset to move to the next position for the next image y_offset += image.height# Save the combined image to the specified output path combined_image.save(output_path)
Uncheck below to merge the pathway figures and score distribution figures together:
# folders = ["test/score_distribute", "test/path_fig"]# for k in tqdm(ref.index):# filename = f"{k}.png"# image_paths = [os.path.join(folder, filename) for folder in folders]# output_path = Path(f"test/combine/{k}.png")# output_path.parent.mkdir(parents=True,exist_ok=True)# combine_images_vertically(image_paths, output_path)